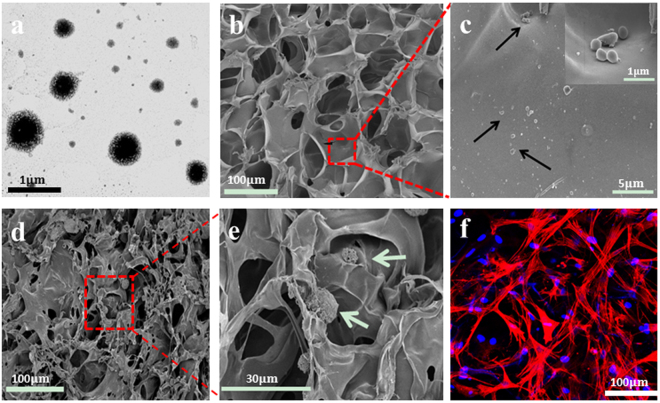
Figure 1.
(a) TEM image of Lipofectamine 2000/pDNA-EGF complexes. (b,c) SEM images of Lipofectamine 2000/pDNA-EGF complexes-loaded collagen-chitosan scaffold (GAS) with different magnifications. The inset image in (c) shows the enlarged view of the highlighted area. Black arrows indicate the Lipofectamine 2000/pDNA-EGF complexes. (d,e) SEM images of GAS/BM-MSCs construct with different magnifications. Green arrows represent the BM-MSCs cultured on GAS. (f) Confocal laser scanning microscopy image of GAS/BM-MSCs construct after being cultured for 7 days, in which nucleus was stained with DAPI (Blue), and cytoskeleton was stained with rhodamine phalloidine (Red).

