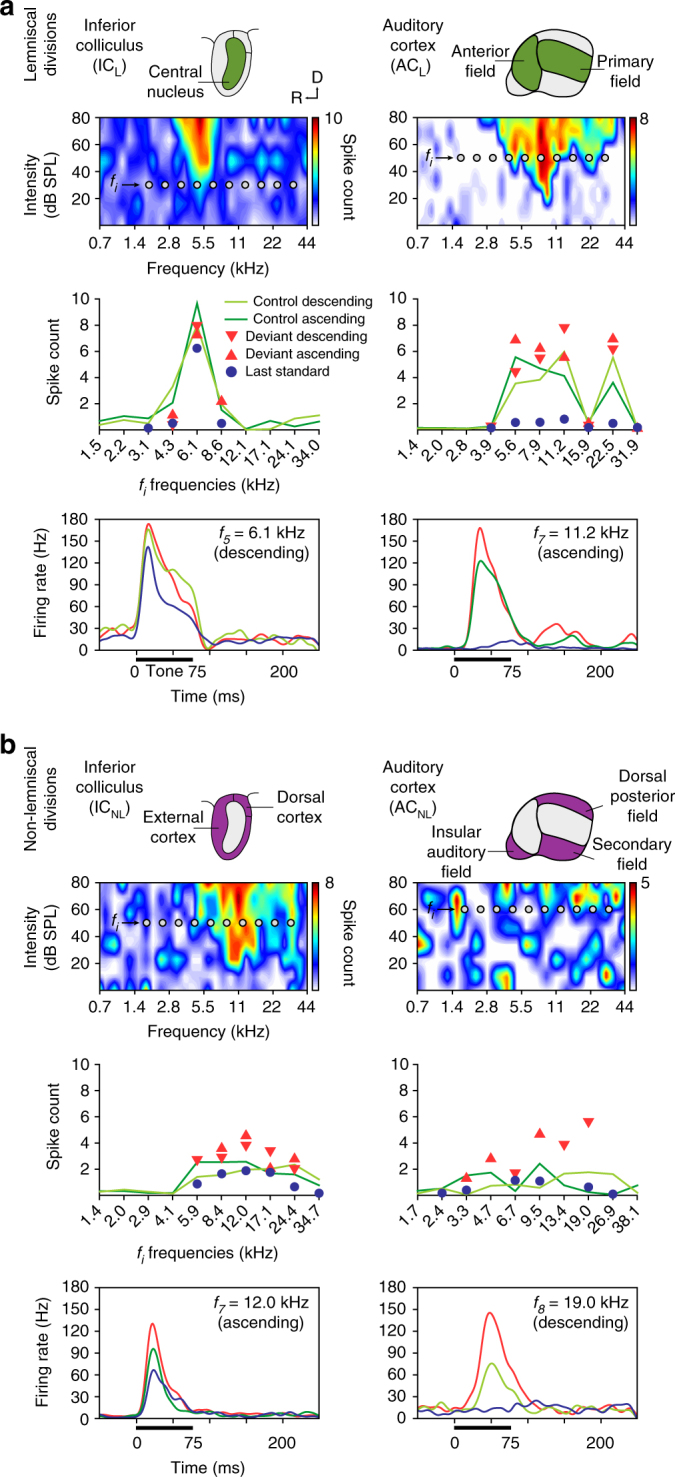
Fig. 6.

Prediction error in representative examples of neuronal responses in awake mouse. a Examples of lemniscal multiunit activity recorded in two auditory nuclei (columns). The first row contains schematics of the lemniscal subdivisions (green) within each station. The second row shows a frequency-response area of each nuclei. Ten grey dots within those frequency-response area represent the ten tones (fi) selected to build the experimental sequences (see Methods). The third row displays the measured responses to each fi tone (baseline-corrected spike counts, averaged within 0–180 ms after tone onset) for all conditions tested. The fourth row contains sample peri-stimulus histagrams comparing the neuronal responses to each condition tested for an indicated fi tone. Stimulus duration is represented by a thick horizontal line. b Examples of multiunit activity recorded in non-lemniscal divisions (first row, colored purple) of each auditory nuclei, organized as in a
