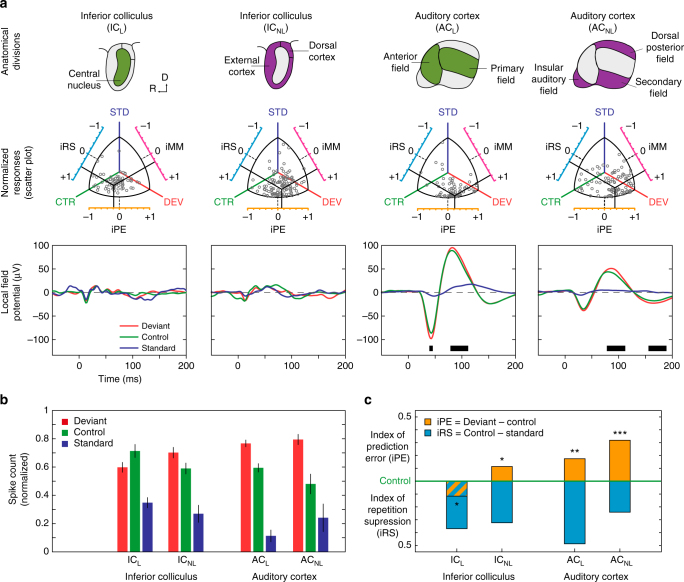
Fig. 7.
Population results for awake mouse. a Summary of population results for each recorded station (columns). The first row displays lemniscal (green) and non-lemniscal (purple) subdivisions of two recorded auditory nuclei of the mouse brain. The second row contains scatter plots featuring normalized responses of each multiunit recording to the same tone played as DEV, STD and CTR (grey dots) and the mean population values of each index (solid black bars). The third row contains the average LFP across all tested tones from each station for different conditions. Thick black bars at the bottom of the panels mark the time intervals were the difference between the deviant LFP and the control LFP is significant, thereby producing a prediction error potential. b Median normalized responses (bar indicate interquartile range) to the deviant, standard and control within each station. c Median indices of prediction error (orange) and repetition suppression (cyan), represented with respect to the baseline set by the control. Asterisks denote statistical significance of iPE against zero median (*p = 0.05, **p = 0.01, ***p = 0.001). Note the overall similarities with results in the anaesthetized rat (Figs. 3–5), confirming a hierarchical generation of prediction error also in awake preparations

