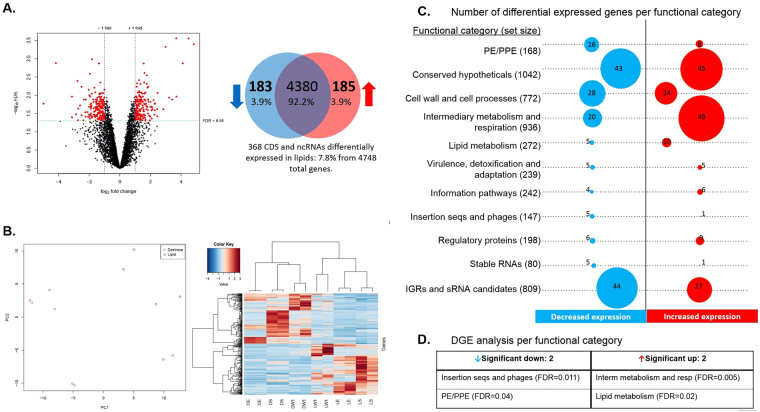
Figure 3.
Differential gene expression of Mtb H37Rv in presence of lipids. Conditions with dextrose were used as control and growth stages were used as batch effect. Counts were normalized using edge R, all genes with a CPM greater than 1 in at least 2 samples were used in the analysis. 368 significant differentially expressed genes were found. (A) Volcano plot (on the left) and its Venn diagram (on the right) where 185 genes with diminished expression and 183 genes with increased expression in presence of lipids are specified. (B) PCA and heatmap plots of the 368 differential expressed genes that were rescaled between −3 and 3, clustering was based on the Pearson correlation. (C) Number of differentially expressed genes by functional categories are shown, circle sizes are proportional to the number of genes with significant differential expression, total number of genes per functional category listed in tuberculist are indicated in parenthesis. (D) Differential functional categories analysis. Only significant expressed categories (FDR < 0.05) are indicated.

