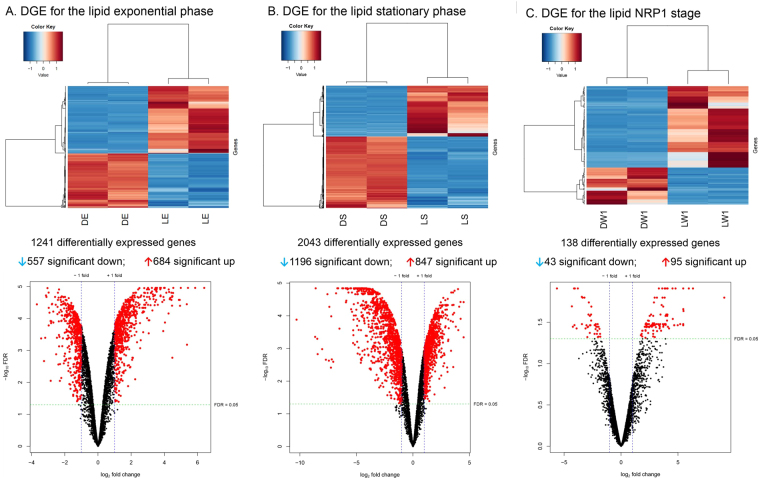
Figure 4.
Differential gene expression of Mtb H37Rv in every stage of growth in presence of lipids. Dextrose conditions were used as controls. The heatmap and volcano plots are shown in figure (A) for the 1241 differentially expressed genes in LE, figure (B) shows the 2043 differentially expressed genes in LS and figure (C) shows the 138 differentially expressed genes in LNRP1. Normalized counts in the heatmap were rescaled between −3 and 3 with clustering based on Pearson correlation and differentially expressed genes were considered significant using a false discovery rate of <0.05 and a log2 fold change >1 or <−1.

