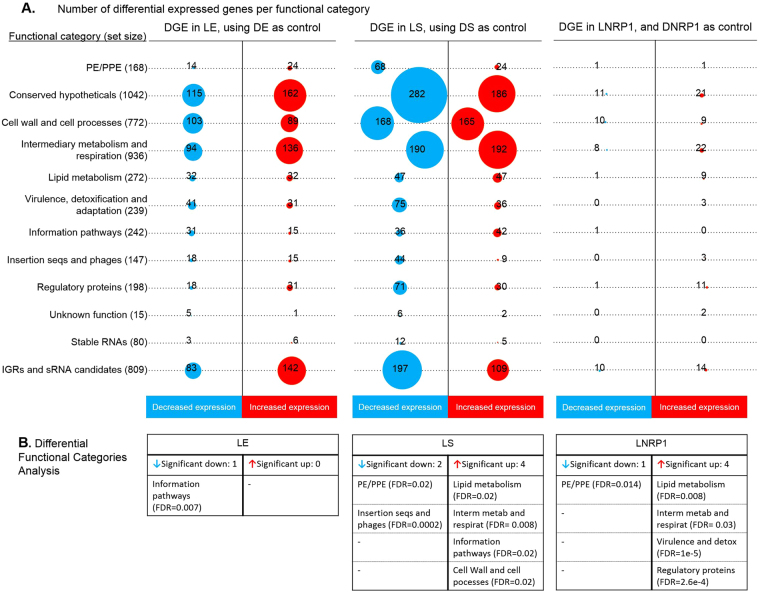
Figure 5.
Differential gene expression per functional categories of every stage of growth of Mtb. (A) The number of differentially expressed genes are shown by functional categories, where circle sizes are proportional to the number of genes with significant differential expression. Blue circles are used for genes with diminished expression and red circles are used for genes with increased expression. Total number of genes per functional category listed in tuberculist are indicated in parenthesis. (B) Differential functional Categories analysis are indicated in tables for every stage of growth, wherein the mean log2 fold change is significantly different from the general mean log2 fold change at a FDR <0.05.

