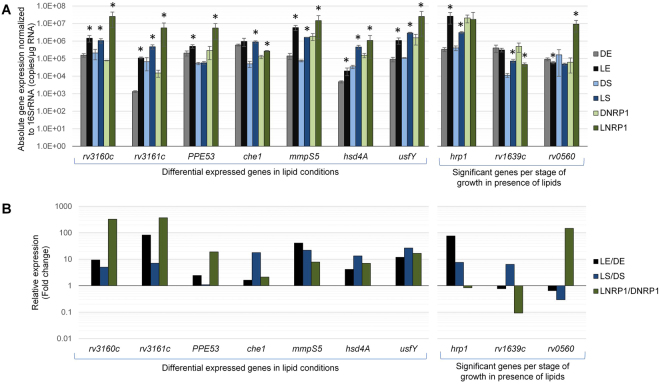
Figure 7.
Validation of ten differential expressed genes in lipid conditions by qRT-PCR. (A) Absolute gene expression during DE (gray bars), LE (black bars), DS (light blue bars), LS (dark blue bars), DNRP1 (light green bars) and LNRP1 (dark green bars) conditions. Data were normalized to the number of copies of rrs gene and results are expressed as log10 of the mean ± SD number of copies per microgram of RNA. Asterisks indicate significant diference between a given lipid stage compared to its respective dextrose stage (LE vs DE, LS vs DS and LNRP1 vs DNRP1), with P < 0.05 considered statistically significant. (B) The relative quantification is expressed as the ratio of [transcription in LE/transcripion in DE] (black bars), the ratio of [transcription in LS/transcription in DS] (blue bars) and the ratio of [transcription in LNRP1/transcription in DNRP1] (green bars).

