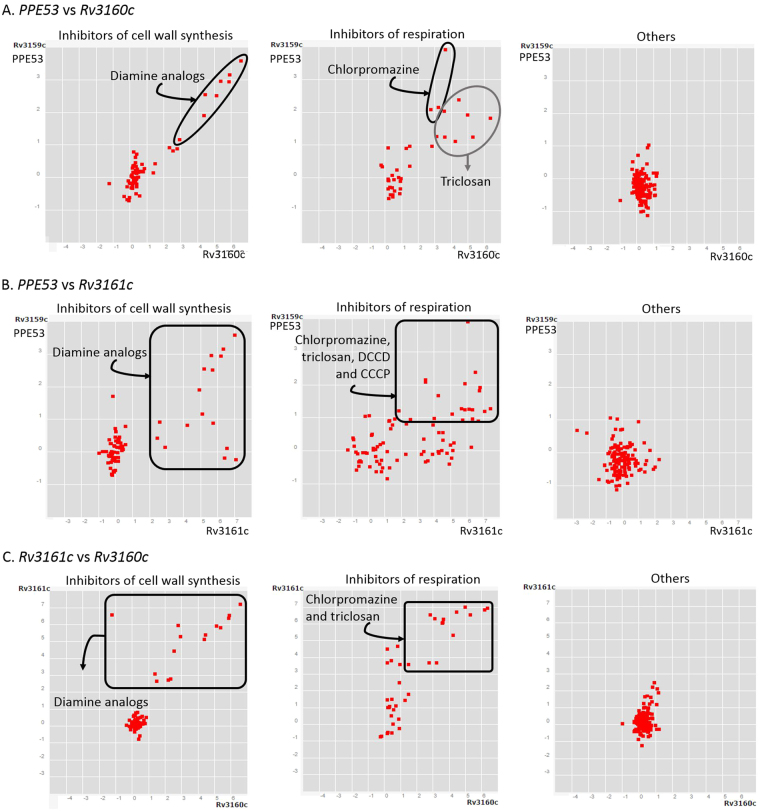
Figure 8.
Correlated gene expression among PPE53, Rv3160c and Rv3161c. Plots show data reported by Boshoff and colleagues through microarray assay, which is deposited in the correlation catalog of the TBDB data base41,42. (A). Comparison between PPE53 and Rv3160c; (B). Comparison between PPE53 and Rv3161C; (C). Comparison between Rv3161c and Rv3161c. Black frames and circles highlight positive correlation between two genes in samples of Mycobacterium tuberculosis under diferent conditions. Gene expression responses of Mtb to 76 treatment groups are represseented by red dots. Plots resumed experimental categories: 1) samples of Mtb under inhibitors of cell wall synthesis (left), 2) samples of Mtb under diferent inhibitors of respiration (middle) and 3) “others” (on the right) inlcludes 8 categories more, such as acidified médium, agents that affect DNA integrty or topology, aromatic amides that can be hydrolyzed intracellylary, growth associated with dosR regulon, inhibitors of protein synthesis, minimal medium with palmitate or succinate as carbon, starvation and transcriptional inhibitors. It can be seen that PPE53, Rv3160c and Rv3161c are mainly co-expressed in compounds that affect cell wall synthesis and respiration. On the other hand, these genes are not induced by compounds from the cathegory “others”.

