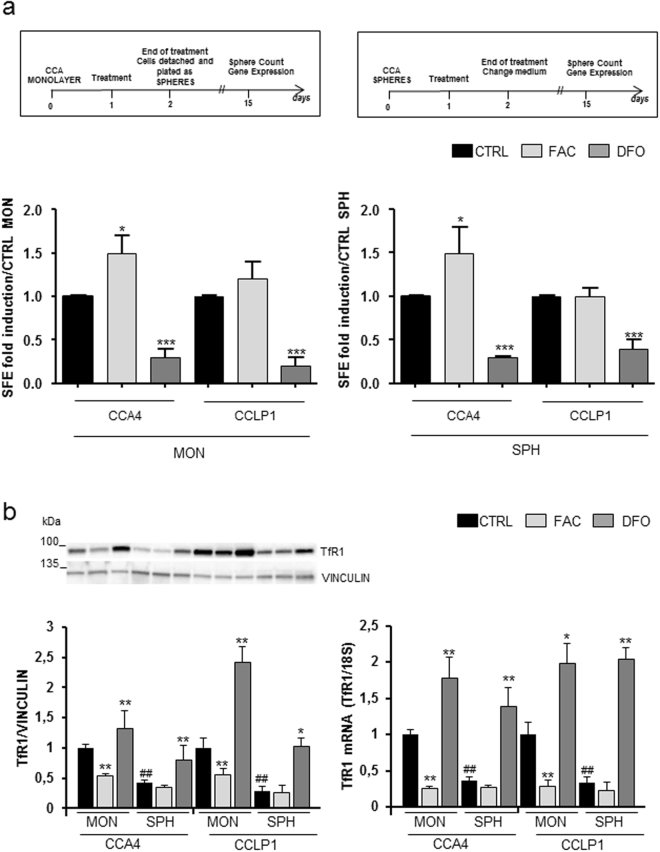
Figure 2.
Effect of different iron availability on self-renewal capacity in vitro. Panel a. Top: schematic overview of the treatment protocols. Bottom: sphere-forming efficiency (SFE) of CCLP1 and CCA4 MON or SPH untreated (CTRL), treated with ferric ammonium citrate (FAC) (100 µg/ml) or desferioxamine (DFO) (100 µM). Mean ± SEM (n = 3), *p ≤ 0.01, ***p ≤ 0.001 vs CTRL MON (left) or vs CTRL SPH (right) for each cell line. Panel b. TfR1 expression in CCLP1 and CCA4 cell lines cultured and treated as described above. Left: cell extracts were reacted with antibodies against transferrin receptor (TfR1) and vinculin. A representative immunoblot analysis and the densitometric quantification are shown. The values were normalized to vinculin and expressed as a fraction of respective MON cells normalized to 1. Mean values ± SEM (n = 6), *p ≤ 0.01, **p ≤ 0.01 vs CTRL MONO for each cell line; ##p ≤ 0.01 vs CTRL SPH. Right: TfR1 mRNA levels were measured by quantitative RT-PCR as described in the legend to Fig. 1. Mean values ± SD (n = 3), *p ≤ 0.05, **p ≤ 0.01 vs CTRL MONO for each cell line.; ##p ≤ 0.01 vs CTRL SPH.

