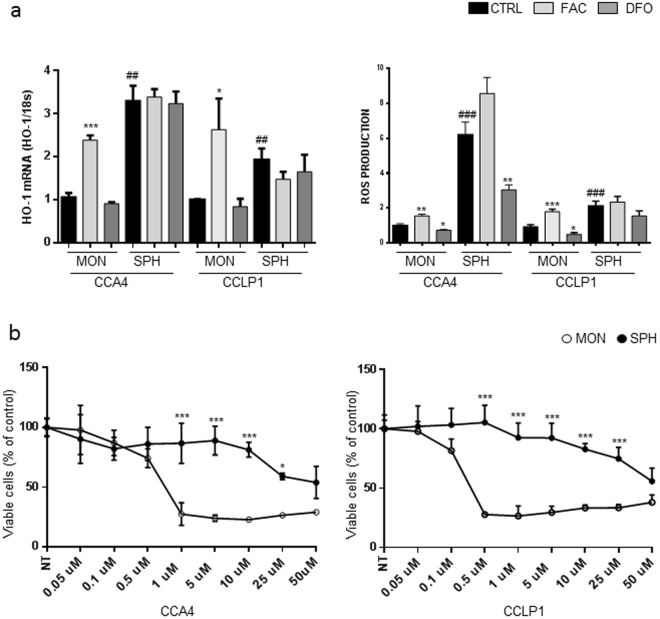
Figure 3.
Redox status and ferroptosis in CCA cells growing as monolayers or spheres. Panel a. CCLP1 and CCA4 cells cultured both as MON and SPH were left untreated (CTRL), treated with ferric ammonium citrate (FAC) (100 µg/ml) or desferioxamine (DFO) (100 µM). Left: HO-1 mRNA levels were measured by quantitative RT-PCR as described in the legend to Fig. 1. Mean values ± SEM (n = 3), *p ≤ 0.05, ***p ≤ 0.001 vs CTRL MON, ##p ≤ 0.01 vs CTRL SPH. Right: ROS production was evaluated by means of the DCFDA assay as described in Materials and Methods. Samples were analyzed in triplicate, normalized to protein content and expressed as percentage of untreated cells normalized to 1. Mean values ± SEM (n = 3), *p ≤ 0.05, **p ≤ 0.01, ***p ≤ 0.001 vs CTRL MON; ###p ≤ 0.001 vs CTRL SPH. Panel b. MON and SPH were treated for 18 h with increasing concentrations of the ferroptosis inducer erastin and cell viability was evaluated by means of the MTT reduction assay. Mean values ± SEM (n = 5), *p ≤ 0.05, ***p ≤ 0.001 vs MON for each point.

