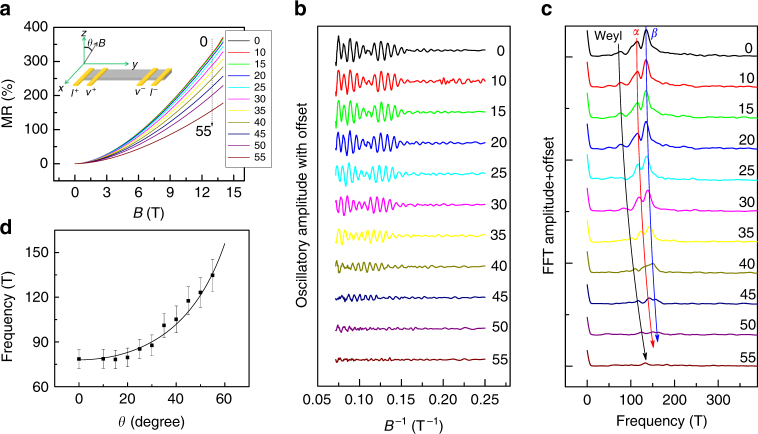
Fig. 2.
Angle-dependent quantum oscillations. a The MR data from b-axis ribbon obtained at different angles and T = 2 K. b The d2 R/dB 2data obtained from a clearly shows quantum oscillations. c The evolution of quantum frequency in FFT spectra obtained from b as the angle increases. The arrow indicates the evolution of the peaks. d Angle dependence of extracted Weyl orbit frequency. It shows a dependence (solid line), indicating a 2D surface state. The error bar of 20%, including standard instrument error and FFT frequency spacing estimate, was added into the angular dependence of frequency

