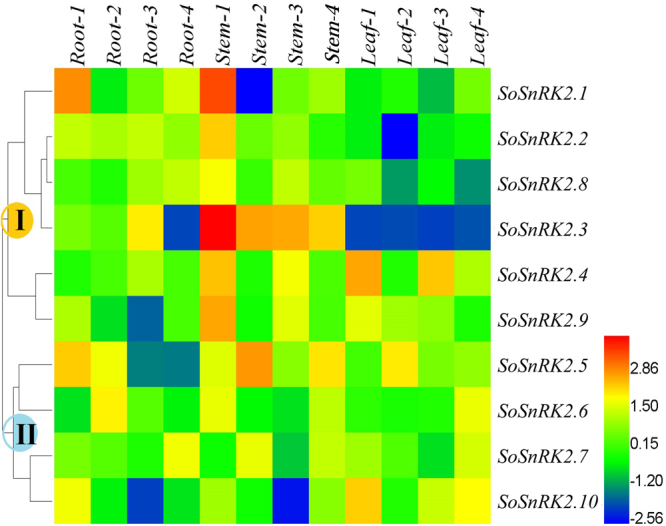
Figure 6.

Organ expression patterns of SoSnRK2 genes during the life cycle in sugarcane plant. The hierarchical cluster displays the expression profile for ten SoSnRK2 genes at different growth stages. Root/Stem/Leaf-1/2/3/4 represents the gene expression in root/stem/leaf under seeding/elongation/mature/blooming stage, respectively. The color bar at the right side represents log2 expression values: Blue represents low expression, green medium expression and red high expression.
