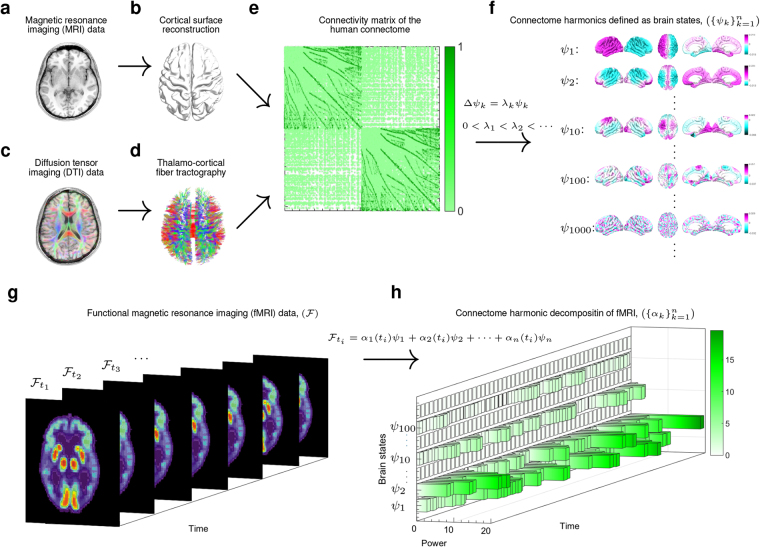
Figure 1.
Illustration of the workflow. T1 magnetic resonance imaging (MRI) data (a) is used to reconstruct the cortical surface between gray and white matter as shown in (b). Diffusion tensor imaging (DTI) data (c) is used to extract thalamo-cortical fibers using deterministic fiber tractography as shown in (d). Both, local and long-distance connections are combined to create the connectivity matrix of the human connectome as illustrated in (e). Connectome harmonics (f) are estimated by applying the Laplace operator Δ to human connectome and computing its eigenvectors (Δψ k = λ k ψ k). Functional magnetic resonance imaging (fMRI) data as illustrated in (g) is decomposed in to the activation of connectome harmonics yielding the power of activation of each of these brain states for each time instance as delineated in (h).

