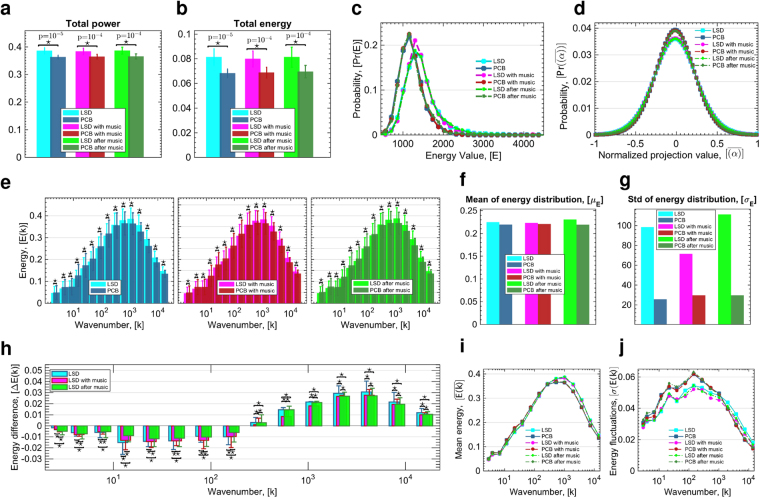
Figure 2.
Changes in energy of brain states under LSD. Total power (a) and total energy (b) of all harmonic brain states for all 6 conditions, where stars indicate significant differences (p < 10−4, two-sample t-test) between each pair of LSD vs. PCB conditions with indicated p-values. (c) Probability distribution of total energy values (sum over all harmonics) for all 6 conditions. (d) Probability distribution of the occurrence of projection values (the amount of contribution) of connectome harmonics after normalization of each harmonic’s contribution by the maximum value of the baseline (PCB) condition, shown for all 6 conditions; LSD, PCB, LSD with-music, PCB with-music, LSD after-music, PCB after-music. (e) Energy of connectome harmonics quantized into 15 levels of wavenumbers k (in the log-scale) for conditions (left) LSD vs. PCB, (middle) LSD with-music vs. PCB with-music, (right) LSD after-music vs. PCB after-music. Stars indicate significant differences (p < 0.01, Monte-Carlo simulations after Bonferroni correction). (f) and (g) show the mean (μ) and standard deviation (σ) of the fit of the energy distribution of frequencies shown in (e) to normal distribution for all conditions, respectively. (h) shows the energy differences for each bin between the conditions LSD and PCB, LSD with-music and PCB with-music, LSD after-music and PCB after-music with stars indicating significant differences between conditions of no music, with music and after music (p < 0.01, Monte-Carlo simulations after Bonferroni correction). Mean (i) and standard deviation (j) of energy values of connectome harmonics shown as a function of the wavenumber k.

