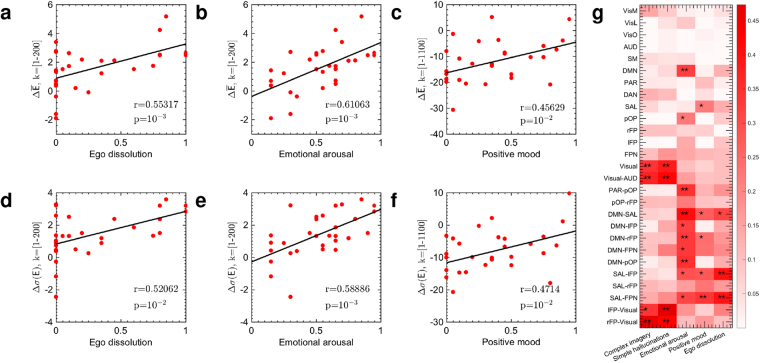
Figure 5.
Correlations between energy changes of connectome harmonics and subjective experiences. (a) and (b) demonstrate significant correlations between the difference in mean energy of connectome harmonics for low frequency connectome harmonics k = [1, …, 200] and the subjective ratings of ego dissolution and emotional arousal, respectively. (c) shows the correlation between the energy difference of connectome harmonics or a broader frequency range of connectome harmonics k = [1, …, 1100] and the subjective ratings of positive mood. (d) and (e) demonstrate significant correlations between the difference in energy fluctuations of connectome harmonics Δ(σ(EPCB) − σ(ELSD)) for low frequency connectome harmonics k = [1, …, 200] and the subjective ratings of ego dissolution and emotional arousal, respectively. (f) shows the correlation between difference in energy fluctuations of connectome harmonics Δ(σ(EPCB) − σ((ELSD)) for k = [1, …, 1100] and the subjective ratings of positive mood. (g) Illustrates multiple correlations between the functional connectivity changes of groups of resting state networks (RSNs) and subjective experiences estimated using 200 brain states, k = [1, …, 200] * p < 10−10, ** p < 10−15 after Bonferroni correction. Correlation strengths are represented by the intensity of red for each pair.

