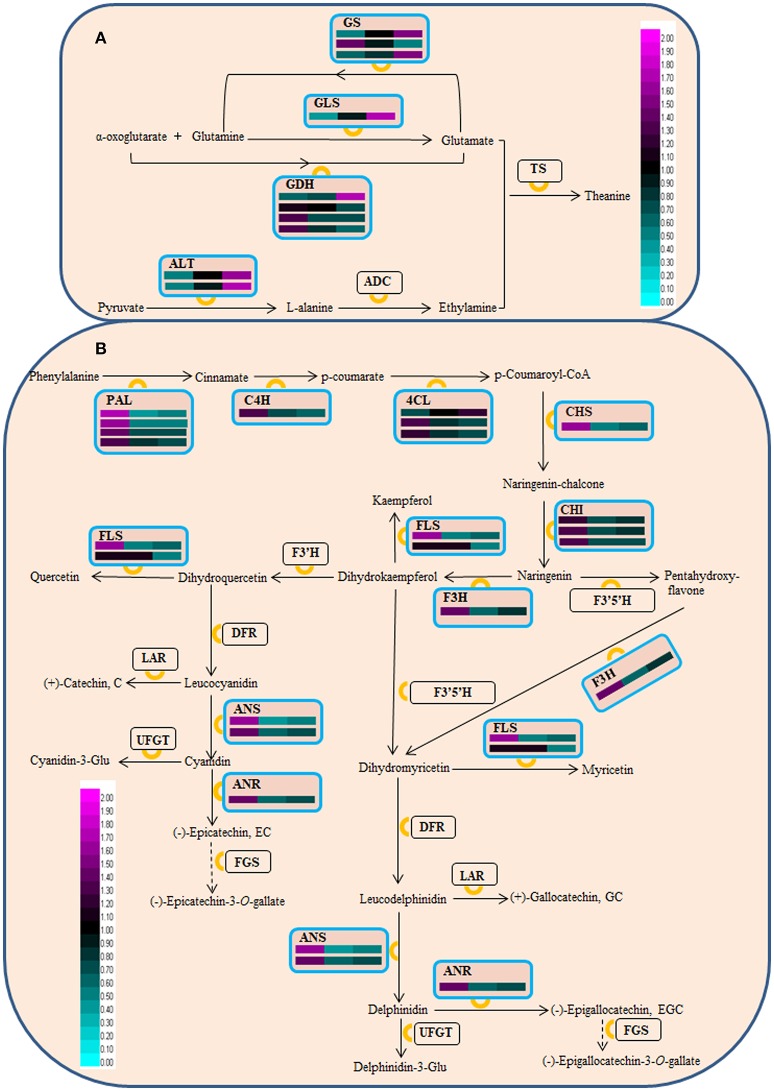
Figure 4.
Schematic representation of DAPs associated with theanine (A) and flavonoid (B) biosynthesis. GS, glutamine synthetase; GLS, glutamate synthase; GDH, glutamate dehydrogenase; ALT, alanine transaminase; ADC, arginine decarboxylase; TS, theanine synthetase; PAL, phenylalanine ammonia-lyase; C4H, cinnamate 4-hydroxylase; 4CL, 4-coumarate coenzyme (Co)A ligase; ANR, anthocyanidin reductase; CHI, chalcone isomerase; CHS, chalcone synthase; DFR, dihydroflavonol 4-reductase; FGS, flavan-3-ol gallate synthase; F3H, flavanone 3-hydroxylase; F3'H, flavonoid 3'-hydroxylase; F3',5'H, flavonoid 3',5'-hydroxylase; FLS, flavonol synthase; LAR, leucocyanidin reductase; ANS, leucoanthocyanidin oxidase; UFGT, UDP-glucose, flavonoid 3-O-glucosyl transferase. This pathway was drawn based on Shi et al. (2011) and Li et al. (2015b). The accumulation level of DAPs during three ‘Anji Baicha’ developmental stages is shown using a heatmap (from left to right: Stage 1, Stage 2, Stage 3).

