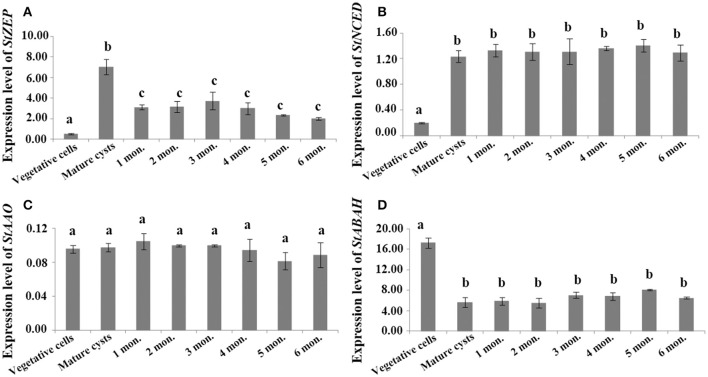
Figure 3.
The transcript levels of genes associated with ABA biosynthesis and catabolism, (A) StZEP (B) StNCED (C) StAAO (D) StABAH, relative to MDH (reference gene) in resting cysts maintained at 20 ± 1°C for different periods of incubation time (0–6 month). The Y axis shows the expression levels of targeted genes relative to the reference gene; Significant differences in abundance are indicated with different letters above bars at p < 0.05; same letter denotes no significant difference. Values are presented as mean ± standard deviation, Error Bars = SD, n = 3.

