
Figure 5.
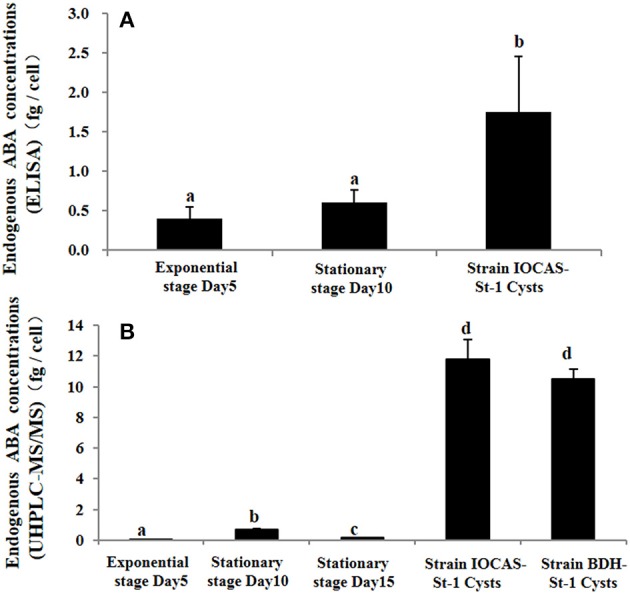
Endogenous ABA concentrations in vegetative cells (at exponential and stationary growth stages) and resting cysts of S. trochoidea via (A) ELISA and (B) UHPLC-MS/MS quantification. Growth stages of strain IOCAS-St-1 were determined according to the growth curve (Supporting information Methods S2). The Y axis shows the expression levels of targeted genes relative to the reference gene; Significant differences are denoted with different letters above bars at p < 0.05; same letter denotes no significant difference. Values are presented as mean ± standard deviation, Error Bars = SD, n = 3.