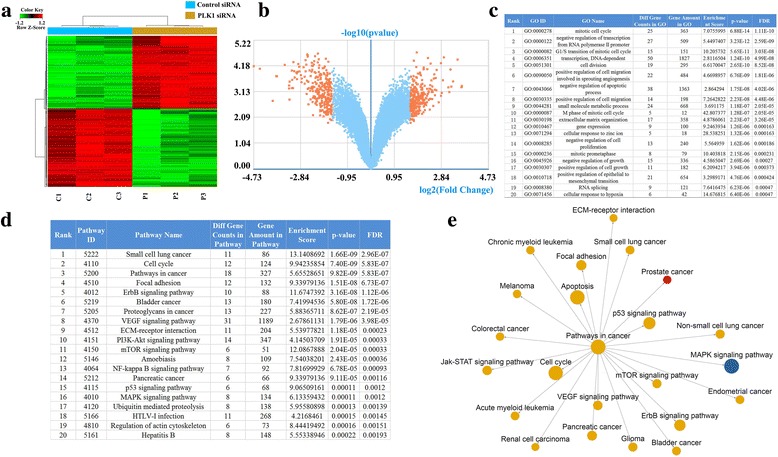
Fig. 2.

Gene expression microarray analyses of the target genes of PLK1 target genes in bladder cancer cells. The A heatmap (a) and volcano map (b) showed showing the differentially expression expressed genes analyzed by the Affymetrix HTA 2.0 Array in control siRNA group and PLK1 siRNA groups. C: control siRNA, P: PLK1 siRNA. The A summary of the top 20 changaltered biological processes or pathways after knockdown of PLK1 knockdown in T24 cells by using GO biological process analysis (c) and KEGG pathway analysis (d). Network analysis of the pathways after knockdown of PLK1 knockdown in T24 cells (e)
