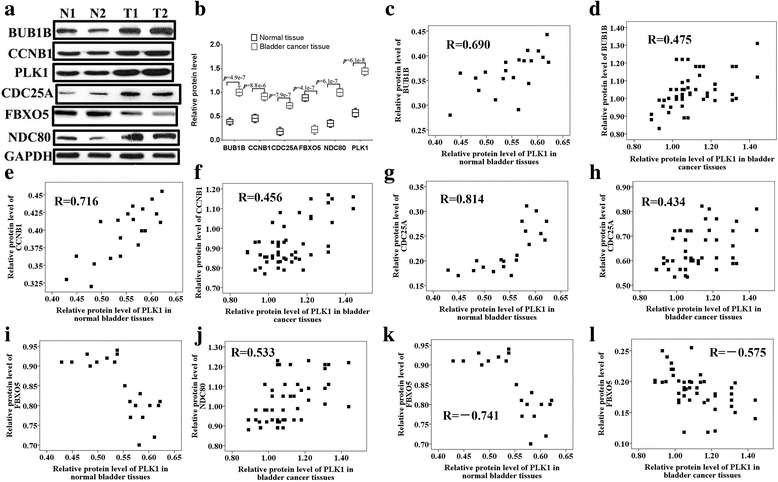
Fig. 5.

Analysis of the cCorrelation analysis between the five key genes and PLK1 in bladder cancer tissues. The protein expression (a, b) levels of the five genes (BUB1B, CCNB1, CDC25A, FBXO5, NDC80) were examined by western blotting. Spearman correlation analysis was applied to compare the relative protein expression levels of PLK1 and the single genes in normal bladder tissues (c, e, g, i, k) and bladder cancer tissues (d, f, h, j, l)
