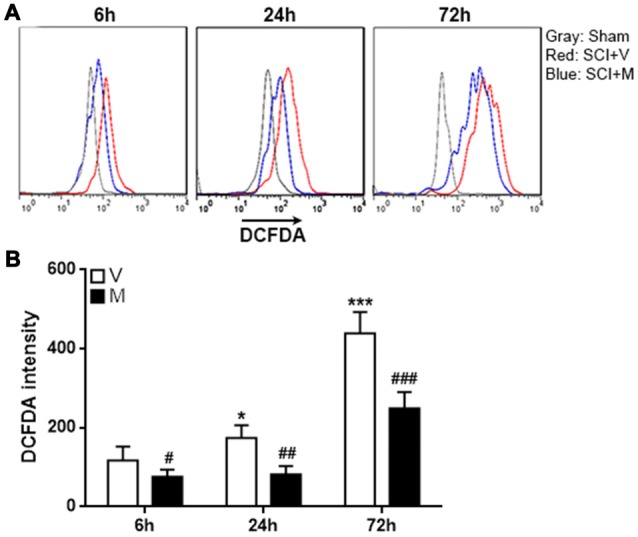
Figure 5.

Methylene blue diminished reactive oxygen species (ROS) production in post-SCI microglia. (A) Representative histograms indicating the H2DCFDA staining. (B) Statistical analysis for the H2DCFDA intensity. V: vehicle; M: methylene blue treatment. *p < 0.05; ***p < 0.001 in comparison with the “6 h” vehicle group. #p < 0.05; ##p < 0.01; ###p < 0.001 in comparison with the corresponding vehicle group at each time point. N = 5 per group.
