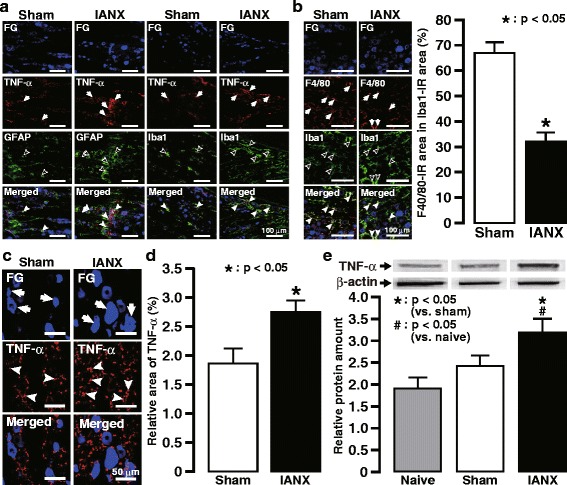
Fig. 3.

TNFα expression in TG following IANX. a TNFα expression in the Iba1-IR cells or the GFAP-IR cells in ipsilateral TG on day 3 following IANX or sham operation. Arrows indicate TNFα-IR cells, open arrowheads indicate GFAP-IR cells or Iba1-IR cells, and close arrowheads indicate TNFα- and GFAP-IR cells or TNFα- and Iba1-IR cells. b F4/80 expression in the Iba1-IR cells in ipsilateral TG on day 3 following IANX or sham operation (left). Arrows indicate F4/80 expression in Iba1-IR cells, open arrowheads indicate Iba1-IR cells, and close arrowheads indicate F4/80- and Iba1-IR cells. The relative area of F4/80 immuno-products in Iba1-IR cells in the TG on day 3 following IANX or sham operation (right). Error bars indicate SEM. ***p < 0.001 vs. sham. (n = 5 in each, Student’s t test). c TNFα expression in ipsilateral TG on day 3 following IANX or sham operation. Arrows indicate FG-labeled neurons. Arrowheads indicate TNFα immuno-products. d The relative area of TNFα immuno-products in the TG on day 3 following IANX or sham operation. Error bars indicate SEM. *p < 0.05 vs. sham (n = 5 in each, Student’s t test). e The relative amount of TNFα protein in TG in naive animals or on day 3 following IANX or sham operation. Error bars indicate SEM. *p < 0.05 vs. sham. #p < 0.05 vs. naive (n = 5 in each, one-way ANOVA with Tukey’s multiple-comparison test)
