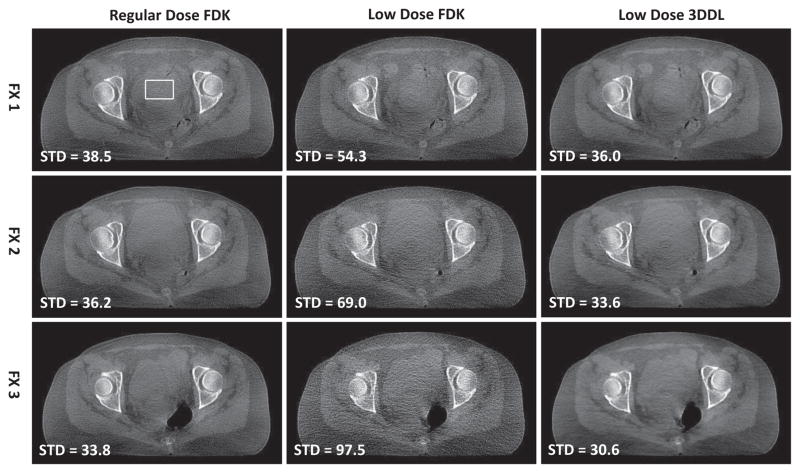
Fig. 9.
Transversal view of the reconstructed images of the GYN patient case in different fractions and different dose protocols. From top to bottom, the images correspond to FX 1, FX 2 and FX 3, respectively. From left to right, the images are regular dose FDK reconstructions, low dose FDK reconstructions and low dose 3DDL reconstructions, respectively. In the second column, from top to bottom, the dose levels are compared to the regular dose levels in the first column. The region in the box is selected for the STD calculation, whose values are displayed in the lower-left corner of each reconstruction, the unit is HU. The display window is [−400 350] HU.

