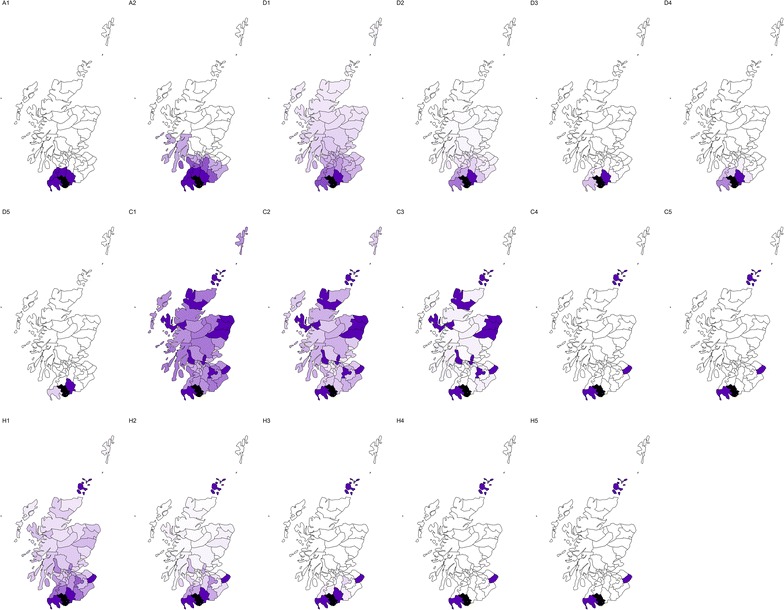
Fig. 1.

Unnormalised weights for ‘area 43’, shaded black, in the Scottish lip cancer data set. Darker purple areas are neighbours with large weights, signifying a high degree of correlation with area 43, as defined by the weights matrix of the respective models, while white areas have weights very close or equal to zero
