Fig. 3.

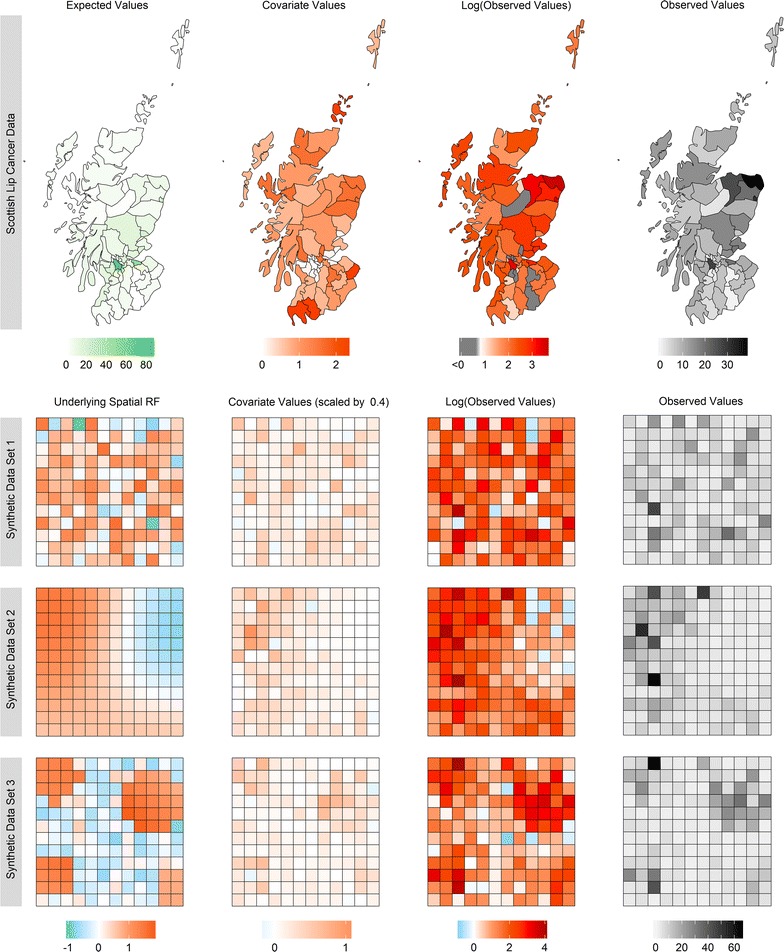
A spatial representation of the expected, covariate, and observed values for the Scottish lip cancer data set, and the main simulated components comprising the generated observed values for the three synthetic data sets

A spatial representation of the expected, covariate, and observed values for the Scottish lip cancer data set, and the main simulated components comprising the generated observed values for the three synthetic data sets