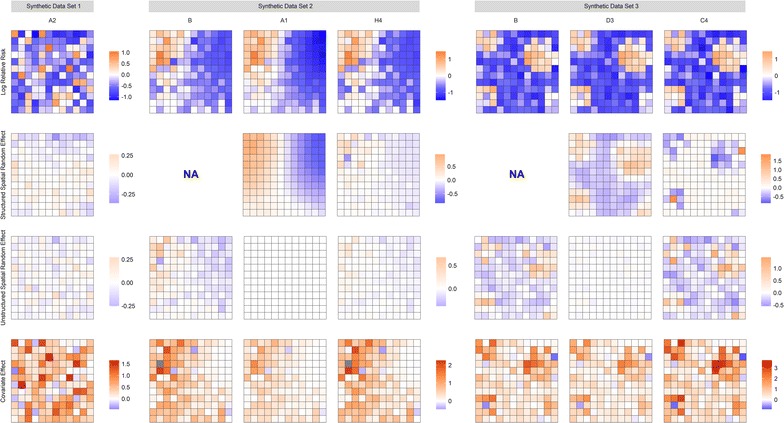
Fig. 8.

Spatial representation of the log-relative risk surface, and a breakdown of its main components: the structured and unstructured spatial random effects and the area-specific covariate effect, i.e. . The values are the posterior means. The two areas shaded grey contain values larger than 5 standard deviations from the mean value. The shadings are consistent across all the plots within a given data set, and the legend shows the range of values for the specific parameter
