Fig. 5.

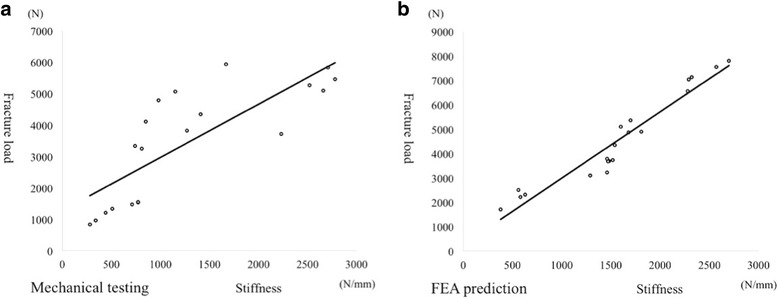
Relationship between fracture load and stiffness. Mechanical testing (a): (fracture load) = 1.6943 × (stiffness) + 1266.9, R2 = 0.6345, p = 0.001. FEA prediction (b): (fracture load) = 2.7207 × (stiffness) + 259.65, R2 = 0.9240, p = 0.001

Relationship between fracture load and stiffness. Mechanical testing (a): (fracture load) = 1.6943 × (stiffness) + 1266.9, R2 = 0.6345, p = 0.001. FEA prediction (b): (fracture load) = 2.7207 × (stiffness) + 259.65, R2 = 0.9240, p = 0.001