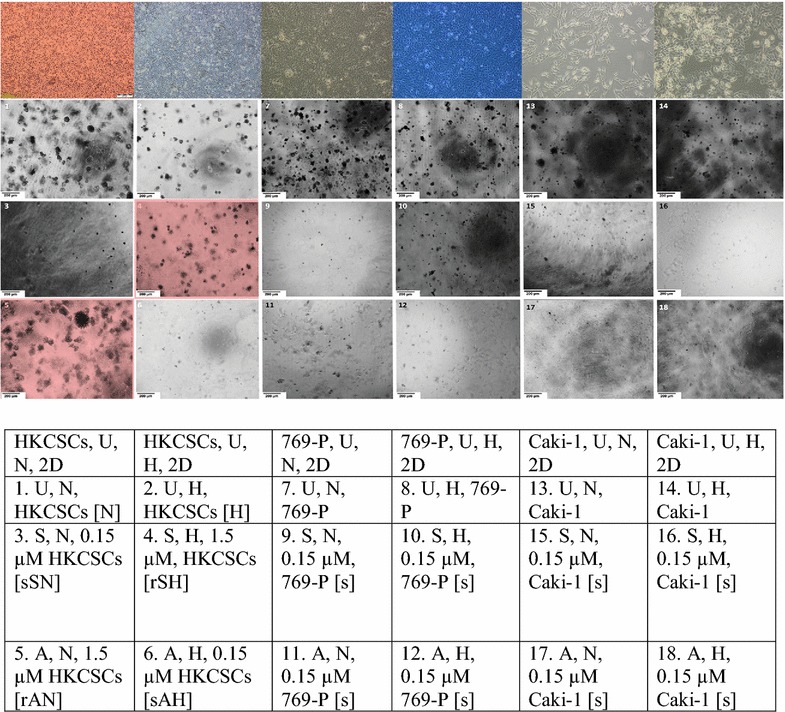
Fig. 4.

HKCSCs cells are resistant to sorafenib in hypoxia and to axitinib in normoxia. Hypoxia decreases the amount of colonies visible in 96-well plates. Representative images of colonies (performed in triplicate). Magnification 4×, scale bar = 200 µm. The scheme of the figure is shown below. Above 2D monolayer cell culture phenotypic view is presented for comparison. U untreated cells, N normoxia, H hypoxia, r resistant cells, s sensitized cells, A axitinib, S sorafenib. Resistant HKCSCs are marked with a red square
