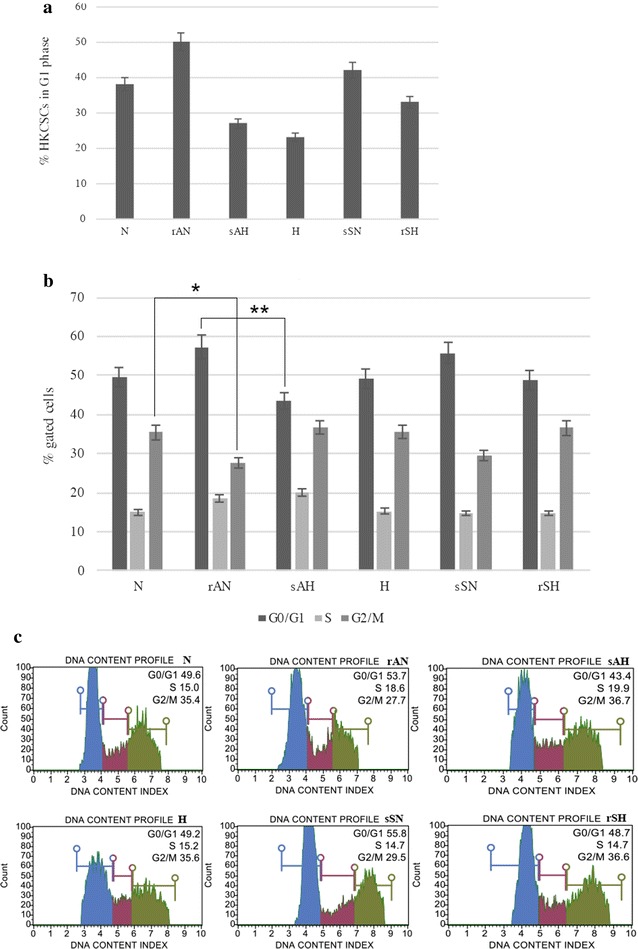
Fig. 7.

% of G1 HKCSCs cells counted on the basis of the equation: G1 = (G0/G1 − G0:Ki67−) show G1 HKCSCs cells (a) and percentage of HKCSCs cells, resistant, sensitized and untreated with sorafenib and axitinib entering each of cell cycle phases (G0/G1, S. G2/M) (b). Bar plots are presented (c). Error bars presented as mean ± SD. Statistically significant results are marked with * when P < 0.001 and ** when P < 0.05 (ANOVA test)
