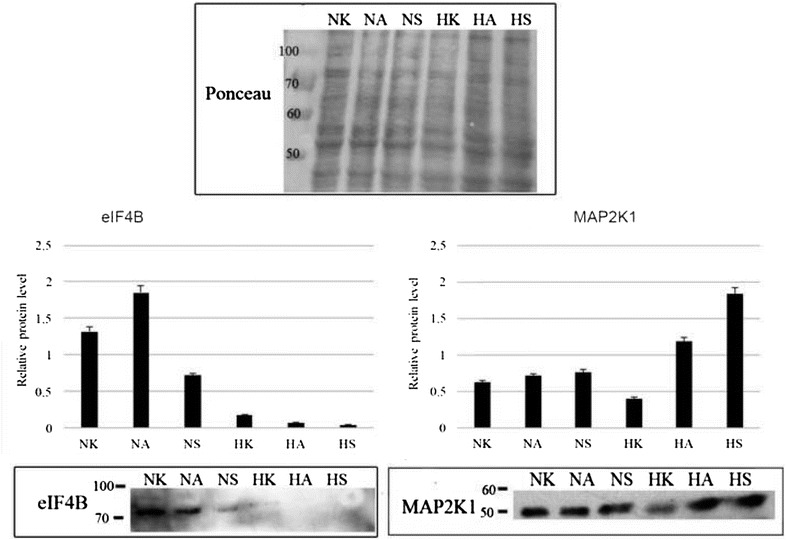
Fig. 8.

Bar graphs represent relative band intensity of map2k1 and eif4b. Quantified mean protein value is relative to Ponceau which was used for normalization. To account for the difference in protein loading during the experiment, the percentage of regulation was calculated after the intensity of each band was adjusted according to its respective Ponceau band intensity using the ImageJ 2.1.4.7. software (National Institutes of Health). Representative western blots are depicted, showing map2k1 and eif4b expression in HKCSCs untreated, resistant and sensitized cells in normoxia and hypoxia. Error bars presented as mean ± SD
