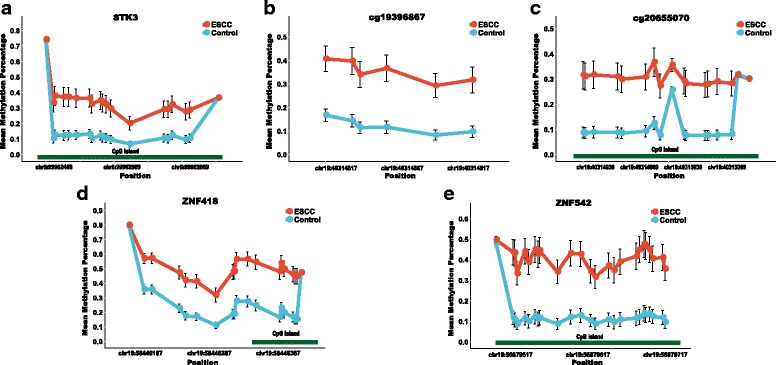
Fig. 2.

The methylation status of the CpG sites in the five genomic regions. a–e represent the methylation status of the CpG sites in regions covering STK3, cg19396867, cg20655070, ZNF418, and ZNF542, respectively. The x-axis represents the genomic positions of the CpG sites in the targeted regions. The y-axis represents the mean methylation percentage in the ESCC tumor tissues as well as the normal tissues for each of the CpG sites. The error bar represents the confidence interval of the methylation percentage in the ESCC tumor tissues as well as the normal tissues for each of the CpG sites
