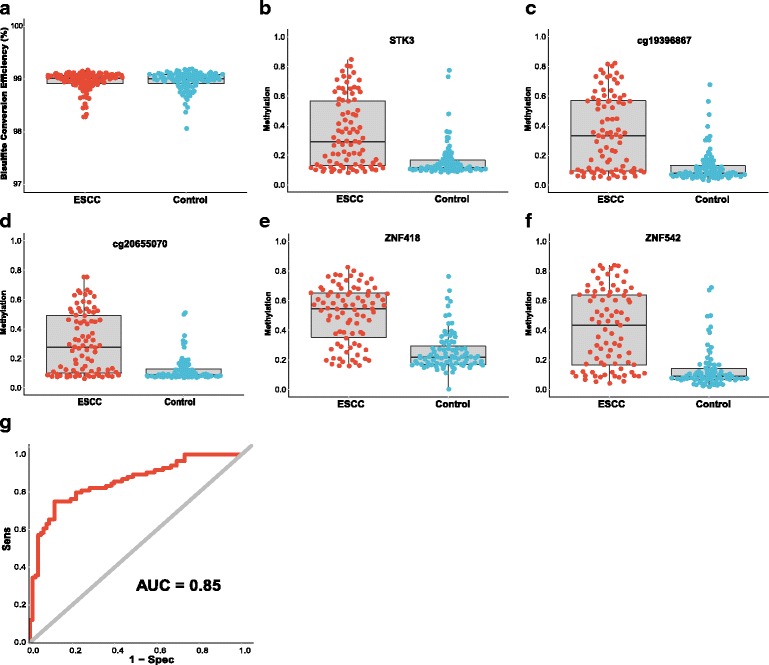
Fig. 3.

The mean methylation status of each genomic region and bisulfite conversion efficiency between ESCC tumors and normal tissues as well as the overall ROC (Receiver Operating characteristics) curve. a represents the bisulfite conversion efficiency between ESCC and adjacent normal tissues. Bisulfite conversion efficiency was calculated by using the number of transformed C to T divided by the number of C in each sample. b–f represent the mean methylation status of the genomic regions covering STK3, cg19396867, cg20655070, ZNF418, and ZNF542, respectively. Each point represents mean methylation percentage in a genomic region of a sample. The boxplot showed overall methylation percentage of different groups in each genomic region. g represents the overall ROC curve, which was calculated through a logistic regression model, incorporating the mean methylation percentage of the five genomic regions as the variables and without the adjustment for gender, age, and smoking status and alcohol status
