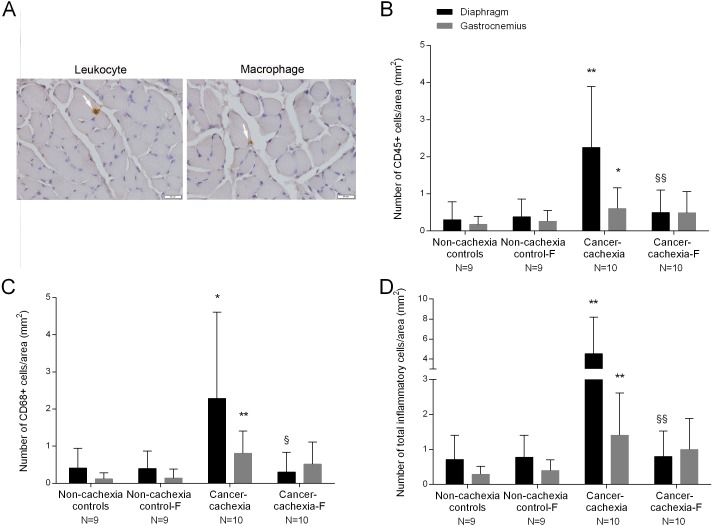
Figure 3. Inflammatory cells in the diaphragm and gastrocnemius muscles.
(A) Representative examples of the localitzation of leukocyte and a macrophage with white arrows in the diaphragm of cancer-cachexia group. Note that the concentration of inflammatory cells is extremely low in the muscle cross sections. (B) Mean values and standard deviation of the number CD45+ cells in the diaphragm (black bars) and gastrocnemius (grey bars) muscles as measured by number of CD45+ cells per area (mm2). Definition of abbreviations: F, formoterol. Statistical significance is represented as follow: * p ≤ 0.05 and ** p ≤ 0.01 between non-cachexia controls and cancer-cachexia rats; §§ p ≤ 0.01 between cancer-cachexia rats and cancer-cachexia rats treated with formoterol. (C) Mean values and standard deviation of the number CD68+ cells in the diaphragm (black bars) and gastrocnemius (grey bars) muscles as measured by number of CD68+ cells per area (mm2). Definition of abbreviations: F, formoterol. Statistical significance is represented as follow: * p ≤ 0.05 and ** p ≤ 0.01 between non-cachexia controls and cancer-cachexia rats; § p ≤ 0.05 between cancer-cachexia rats and cancer-cachexia rats treated with formoterol. (D) Mean values and standard deviation of the number of inflammatory cells (CD45+ and CD68+) in the diaphragm (black bars) and gastrocnemius (grey bars) muscles as measured by number of inflammatory cells per area (mm2). Definition of abbreviations: F, formoterol. Statistical significance is represented as follow: ** p ≤ 0.01 between non-cachexia controls and cancer-cachexia rats; §§ p ≤ 0.01 between cancer-cachexia rats and cancer-cachexia rats treated with formoterol.

