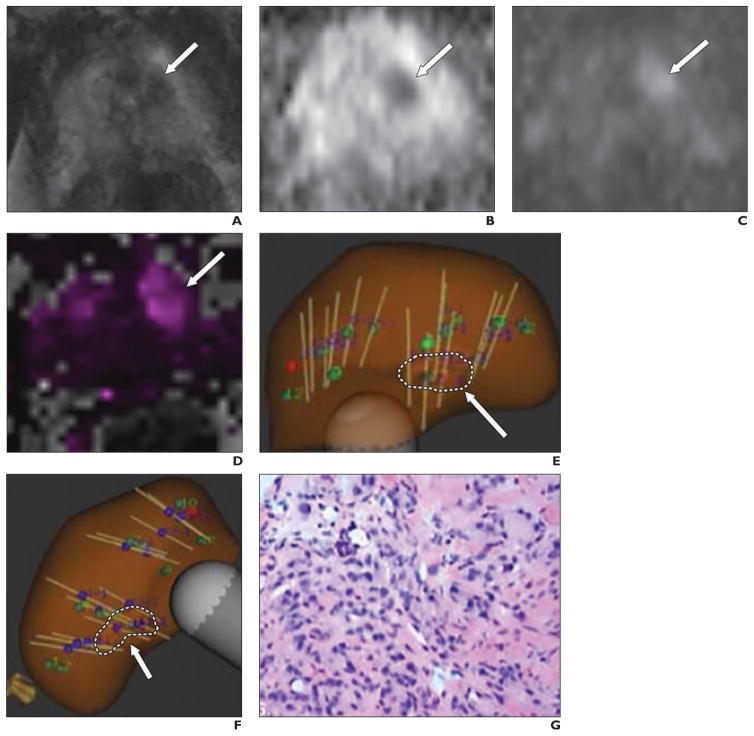
Fig. 2.
65-year-old man with prostate-specific antigen density of 0.15 ng/mL2 and 9-mm lesion in left anterior transition zone assessed as Prostate Imaging Reporting and Data System version 2 category 3.
A–D, Axial T2-weighted image (A), apparent diffusion coefficient (ADC) map (B), DW image (b = 1400 s/mm2) (C), and forward volume transfer constant (Ktrans) map (D) show lesion (arrows). Lesion ADC was 919 mm2/s.
E and F, Transverse (E) and longitudinal (F) images from MRI/ultrasound fusion biopsy show multiple biopsy cores traversing target (arrows, dashed lines).
G, Photomicrograph of pathologic specimen obtained at biopsy. Gleason score was 4 + 3.

