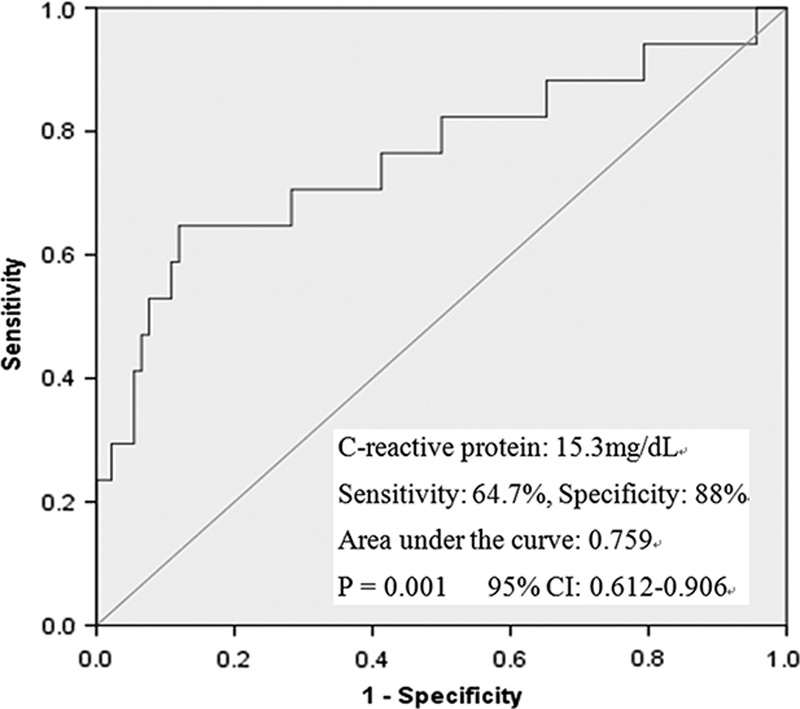
FIGURE 2.

The results of the receiver-operating characteristic curve analysis of the C-reactive protein levels. CI indicates confidence interval.

The results of the receiver-operating characteristic curve analysis of the C-reactive protein levels. CI indicates confidence interval.