
FIGURE 2.
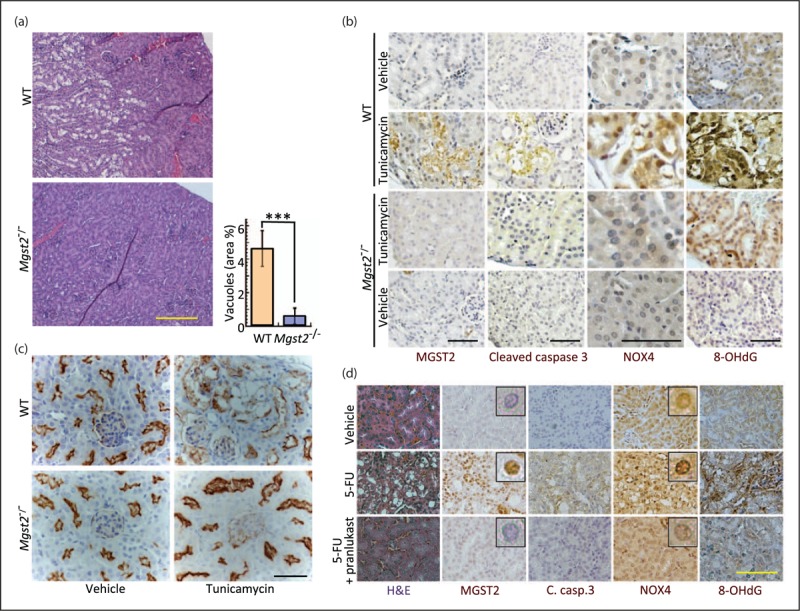
Mgst2 deficiency and pranlukast attenuate nephrotoxic drug-triggered DNA damage and apoptosis in mouse kidneys. (a) Hematoxylin–eosin stained kidney slices from wild type and Mgst2-deficient mice treated with tunicamycin (a single dose of 1.5 mg/ kg, i.p.). Kidneys were removed and processed on day 4. Bar = 200 μm. Percentage area of vacuoles represents the damage to kidney cells. n = 5, ∗∗∗P < 0.001. Values are means ± SD. No vacuoles were observed in kidneys of untreated mice. (b) Immunohistochemical staining of the indicated markers in kidney sections of mice treated as in (a). Notice the nuclear accumulation of NOX4. 8-OHdG is a marker of oxidative DNA damage. Bars = 50 μm. (c) Immunohistochemical stains of proximal tubules (brown) using antiaminopeptidase A in kidney sections from wild type and Mgst2-deficient mice treated with tunicamycin as in (a). Nuclei were counterstained with hematoxylin (grey-blue). Bar = 50 μm. Notice the damage to the tubular cells and its absence in the Mgst2-deficient mice. (d) Hematoxylin–eosin (H&E) stain and immunohistochemical staining of the indicated proteins and of 8-OHdG in kidney slices of wild type mice treated with 5-FU (300 mg/kg, i.p. at time = 0) followed by six administrations of PBS or pranlukast (Pran., 3 mg/kg, i.p., administered at days 0, 1, 2 and 5–7). Kidneys were processed at day 13. Bar = 50 μm. Insets: enlarged images showing immunostained nuclei. Reproduced from an open access article [34▪▪].