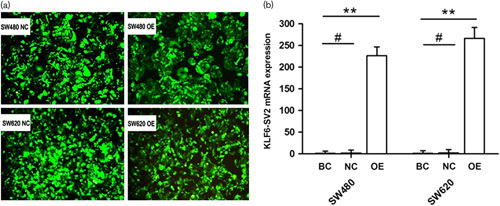
Fig. 2.

Construction of SW480 and SW620 stable cell lines over-expressing KLF6-SV2. (a) Expression intensity of GFP under fluorescent microscope. (b) Expression of the KLF6-SV2 mRNA in every group. BC, blank control group; GFP, green fluorescent protein; KLF6, Kruppel like factor 6; NC, negative control group; OE, over-expressing group. **P<0.01, #P>0.05.
