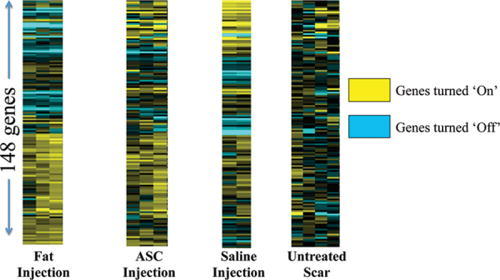
Fig. 7.

Heat map of different treatment groups. Each bar represents a different gene being expressed in a known database with clusters reflecting gene expression signatures indicative of how the added cell preparations modify the wound healing response.
