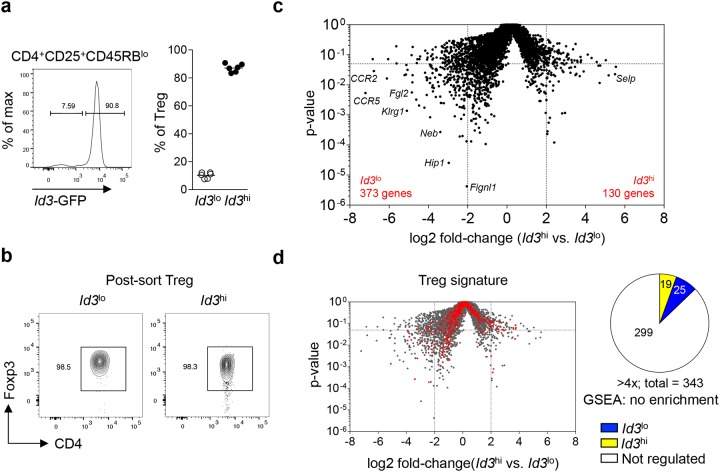
Figure 1. Id3 expression separates Treg cells into two a transcriptionally distinct populations.
(a) Id3 expression in splenic Treg cells (CD4+CD25+CD45RBlo) from naive Id3GFP/+ mice using flow cytometry (left) and quantification of the percentage of Id3lo and Id3hi cells among splenic Treg cells (right). Each symbol represents an individual mouse and horizontal lines are the mean. (b) Foxp3 expression of sorted Id3lo and Id3hi splenic Treg cells (CD4+CD25+CD45RBlo) from naive Id3GFP/+ mice by flow cytometry. (c) Volcano plot comparing the p-value versus log2 fold-change in gene expression of Id3hi versus Id3lo Treg cells. (d) Volcano plot from (c) with canonical Treg cell signature genes [30] highlighted in red. Pie chart shows the number of Treg cell signature genes up-regulated more than 4-fold in Id3lo (blue) or Id3hi (yellow) Treg cells.

