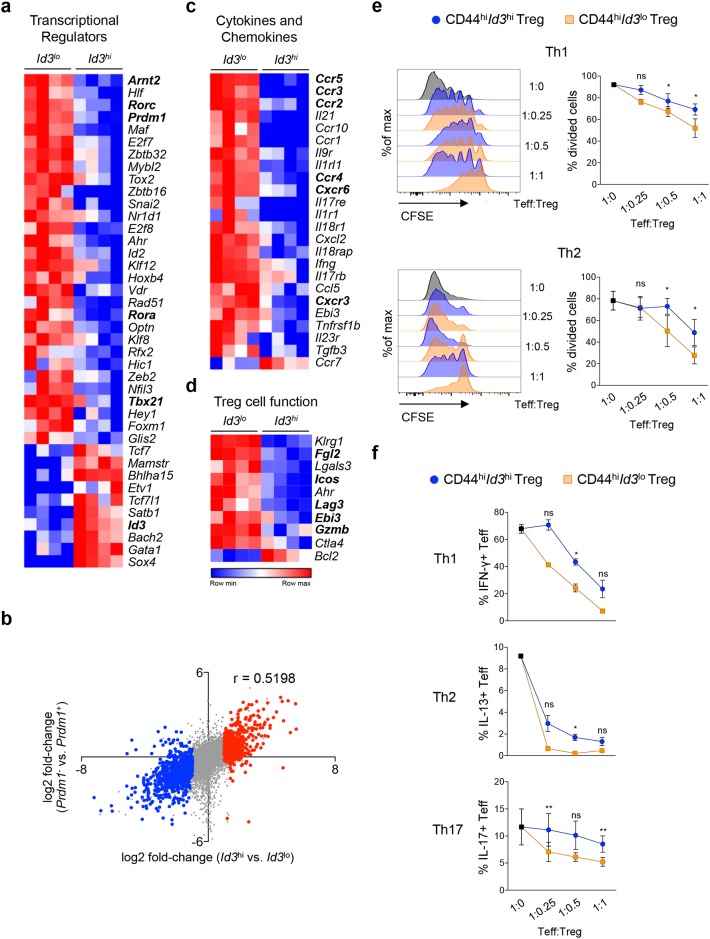
Figure 3. Id3lo Treg cells are highly suppressive.
(a) Heatmap of genes encoding for transcriptional regulators that are differentially (> 4-fold) expressed in splenic Id3hi compared to Id3lo Treg cells (CD4+CD25+CD45RBlo) of naive Id3GFP/+ mice. RNA was obtained from 4 independent experiments. (b) Difference in transcript abundance in Id3hi versus Id3lo Treg cells plotted against that in Prdm1- versus Prdm1+ Treg cells [35]. Colors indicate transcripts significantly up-regulated more than 2-fold in Id3lo (blue) or Id3hi (red) Treg cells. The r-value of Spearman correlation is indicated. (c, d) Heatmaps of genes encoding for (c) cytokines, chemokines and their receptors and (d) genes encoding for molecules involved in Treg cell function that are differentially (> 4-fold) expressed in splenic Id3hi compared to Id3lo Treg cells (CD4+CD25+CD45RBlo) of naive Id3GFP/+ mice. RNA was obtained from 4 independent isolations. (e, f) 105 CFSE labeled CD4+ effector T (Teff) cells (Thy1.1) were co-cultured under Th1, Th2 or Th17 cell polarizing conditions with sorted CD44hiId3hi (blue) or CD44hiId3lo (orange) Treg cells (CD4+CD25hi) from IL2/IL2mAb treated Id3GFP/+ mice (Thy1.2). (e) Representative CFSE fluorescence of Teff cells (Thy1.1+) cultured at the indicated Treg/Teff cell ratios and quantification of the percentage of divided Teff cells. Mean ± SEM from 3 independent experiments are shown. *p < 0.05; ns = not significant (paired Student’s t test). (f) Flow cytometric quantification of the percentage of Teff cells (Thy1.1+) expressing IFNγ, IL13 or IL17A after restimulation with PMA/Iono for 4 hours. Mean ± SEM from 3 independent experiments (Th1, Th17) or mean ± SEM from several wells of 1 representative experiment (Th2) are shown. *p < 0.05; **p < 0.01; ns = not significant (Student’s t test).

