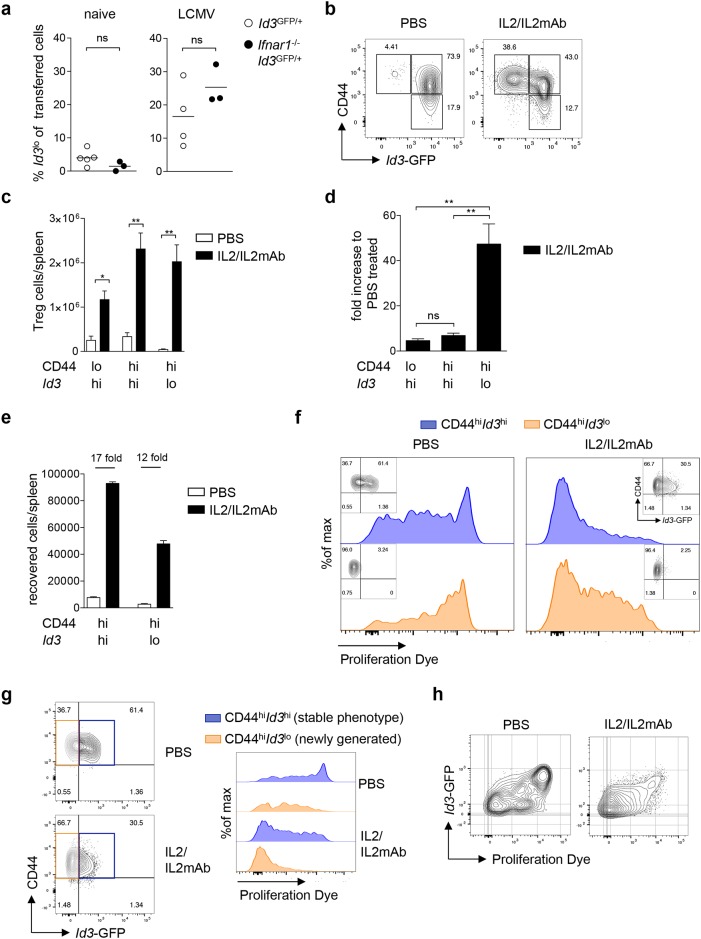
Figure 5. Differentiation into Id3lo Treg cells is promoted by IL2 signaling.
(a) Id3hi Treg cells (CD4+CD25+CD45RBlo) purified from naive Id3GFP/+ or Ifnar1-/-Id3GFP/+ mice (Thy1.2) were transferred into wt mice (Thy1.1). One day after transfer, mice were left untreated or infected with 200 pfu LCMV WE. The percentage of Id3lo Treg cells among transferred cells (Thy1.2+) 7 days post-transfer in spleens of naive or LCMV WE infected host mice. Results from 1-3 mice per experiment were pooled and the mean value from each of 3-5 independent experiments is presented by the symbols. The horizontal lines are the mean of all experiments. ns = not significant (unpaired Student’s t test). (b) Id3 and CD44 expression in splenic Treg cells (CD4+CD25+) of PBS or IL2/IL2mAb treated Id3GFP/+ mice at day 5 after treatment. (c) Total cell number of CD44loId3hi, CD44hiId3hi and CD44hiId3lo Treg cells (CD4+CD25+) in spleens of PBS or IL2/IL2mAB treated mice. Mean ± SEM from at least 4 independent experiments are shown. *p < 0.05, **p < 0.01 (unpaired Student’s t test). (d) Fold increase in CD44loId3hi, CD44hiId3hi and CD44hiId3lo Treg cells in IL2/IL2mAb treated mice compared to PBS treated mice. Mean ± SEM from at least 4 independent experiments are shown. **p < 0.01; ns = not significant (unpaired Student’s t test). (e-h) CD44hiId3hi and CD44hiId3lo Treg cells (CD4+CD25+) from IL2/IL2mAb treated Id3GFP/+ mice (Thy1.2) were labeled with a proliferation dye and transferred into wt mice (Thy1.1). Transferred cells (Thy1.2+) were analyzed 7 days post-transfer in the spleens after PBS or IL2/IL2mAB treatment. (e) Absolute numbers of recovered Thy1.2+ cells. (f) Representative analysis of Id3 and CD44 expression (small insets) and proliferation of Thy1.2+ cells recovered after transferring CD44hiId3hi (blue) or CD44hiId3lo (orange) Treg cell populations. (g) Id3 and CD44 expression of recovered Thy1.2+ cells in spleens of PBS or IL2/IL2mAB treated mice that had received CD44hiId3hi Treg cells (left). Representative proliferation analysis of recovered phenotypically stable Thy1.2+CD44hiId3hi (blue) or newly generated Thy1.2+CD44hiId3lo (orange) cells in spleens of PBS or IL2/IL2mAB treated mice that had received CD44hiId3hi Treg cells (right). (h) Representative analysis of Id3 expression versus proliferation of recovered Thy1.2+ cells in spleens of PBS or IL2/IL2mAB treated mice that had received CD44hiId3hi Treg cells.

