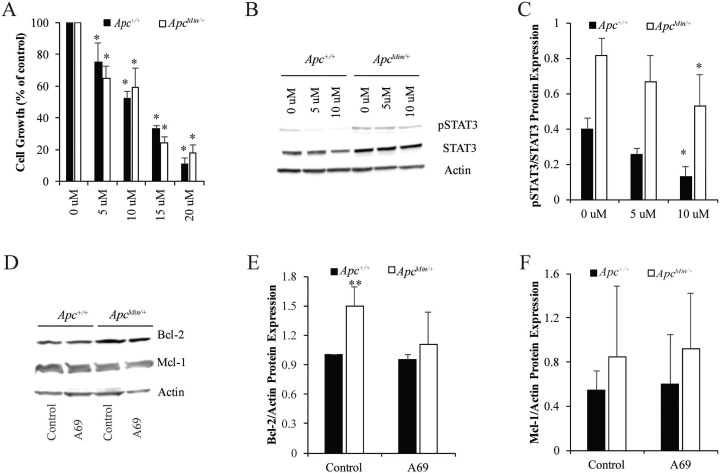
Figure 3. STAT3 inhibition in MMTV-PyMT;ApcMin/+ and MMTV-PyMT;Apc+/+ cells.
(A) Cell growth was measured for 24 hours with treatment 0–20 μM A69, a small molecule inhibitor of STAT3. Data are shown as the percent of cells compared to the untreated control (set to 100% for each cell line individually). (B) Representative western blots for pSTAT3/STAT3 after treatment with 0–10 μM of A69 for 24 hours. (C) Quantification of pSTAT3/STAT3 western blots show that 10 μM modestly decreases STAT3 phosphorylation in both cell lines. 10 μM was selected as the dose for A69 for future studies. (D) Representative western blots for Mcl-1 and Bcl-2 after 24-hour treatment with 10 μM A69. (E–F) Quantification of Bcl-2 and Mcl-1 western blots demonstrates that A69 does not affect Bcl-2 or Mcl-1 expression. Each experiment was repeated at least 3 times and data are shown as means +/- SD; *P < 0.05 compared to solvent control, **P < 0.05 comparing MMTV-PyMT; ApcMin/+ to MMTV-PyMT; Apc+/+ cells.

