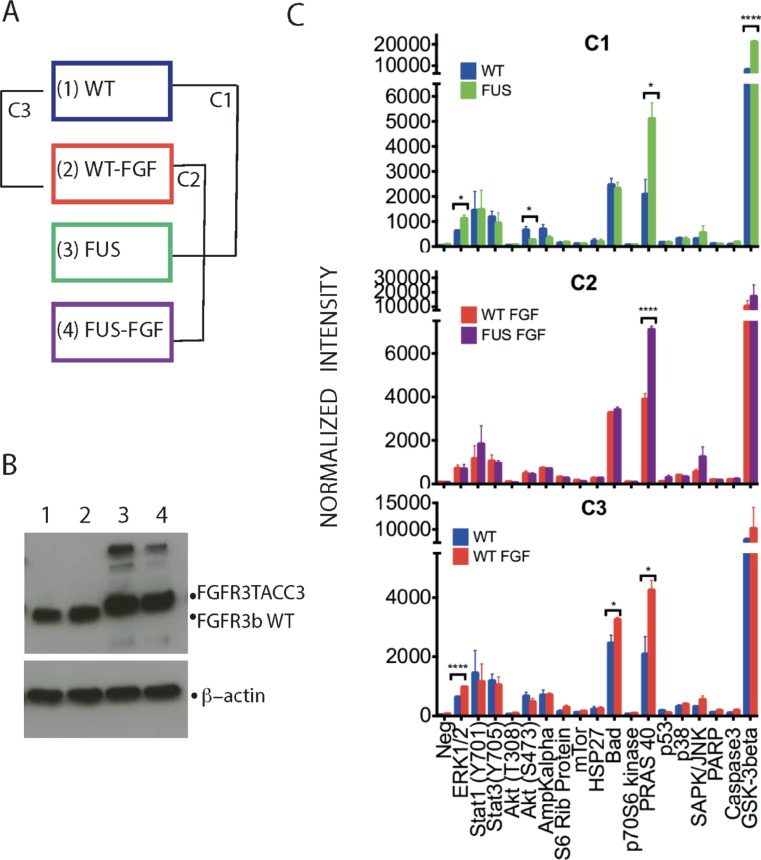
Figure 1. Phosphorylation profiles of selected intracellular signalling proteins allows initial comparison of WT and FUS and their responses to FGF stimulation.
(A) Two TERT-NHUC cells lines, stably expressing either the WT FGFR3 (IIIb) or FGFR3-TACC3 fusion, were analysed without or following stimulation by 100 ng/ml FGFR1 for 10 min (in both cases 100 IU/ml heparin was included in incubation medium for 10 min). The four resulting experimental conditions have been designated as WT (1), WT-FGF (2), FUS (3) and FUS-FGF (4). Further comparisons of data generated from these conditions were between WT and FUS (comparison 1; C1), WT-FGF and FUS-FGF (comparison 2; C2) and WT and WT-FGF (comparison 3; C3). (B) Western blotting with anti-FGFR3 antibody to detect WT FGFR3 or FGFR3-TACC3 fusion in cell lysates from four experimental conditions described in (A): WT (1), WT-FGF (2), FUS (3) and FUS-FGF (4) (top panel). β-actin was used as a loading control (bottom panel). (C) Antibody array analysis comprising indicated proteins and their phospho-sites performed using cell lysates from four conditions, defined and compared as outlined in (A). Comparisons cover WT and FUS (C1) (top panel), WT-FGF and FUS-FGF (C2) (middle panel) and WT and WT-FGF (C3) (bottom panel). Data are shown as average signals from two independent experiments on two different biological replicates (number of stars: significantly changing phosphosites, unpaired Student’s t-test, p ≤ 0.05. Error bars: S.E.M.). See Supplementary Figure 1 for further information about the antibody array and analyses.

