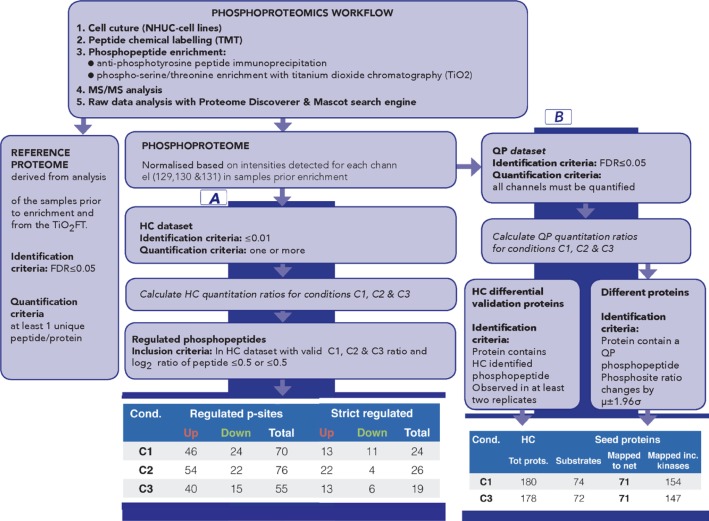
Figure 2. Overview of phosphoproteomics workflow for data generation and analysis.
The workflow provides both phospho and reference proteome datasets. Part A of the data analysis workflow, based on High Confidence (HC) quantitative proteomics dataset, has been designed to identify the most significantly regulated phosphosites between C1, C2 and C3. Number of regulated and sites for each comparison is summarised (part A, last panel); strict regulated sites additionally require >1 replicate and that μ±1.96σ does not include 1. Part B of the data analysis workflow has been designed to generate seeds for subsequent network analysis; it is based on Quantitative Proteomics (QP) dataset [QP requires all channels to be quantified but with a less stringent FDR (5%)] to allow a broad pool of initial seeds while HC dataset is used to filter pathway results. Number of proteins for C1 and C3 is shown (part B, last panel). See also Supplementary Tables 1– 6 and Supplementary Figure 2 (for replicate correlations) and Supplementary Figure 4 (for comparison of HC and QP datasets).

