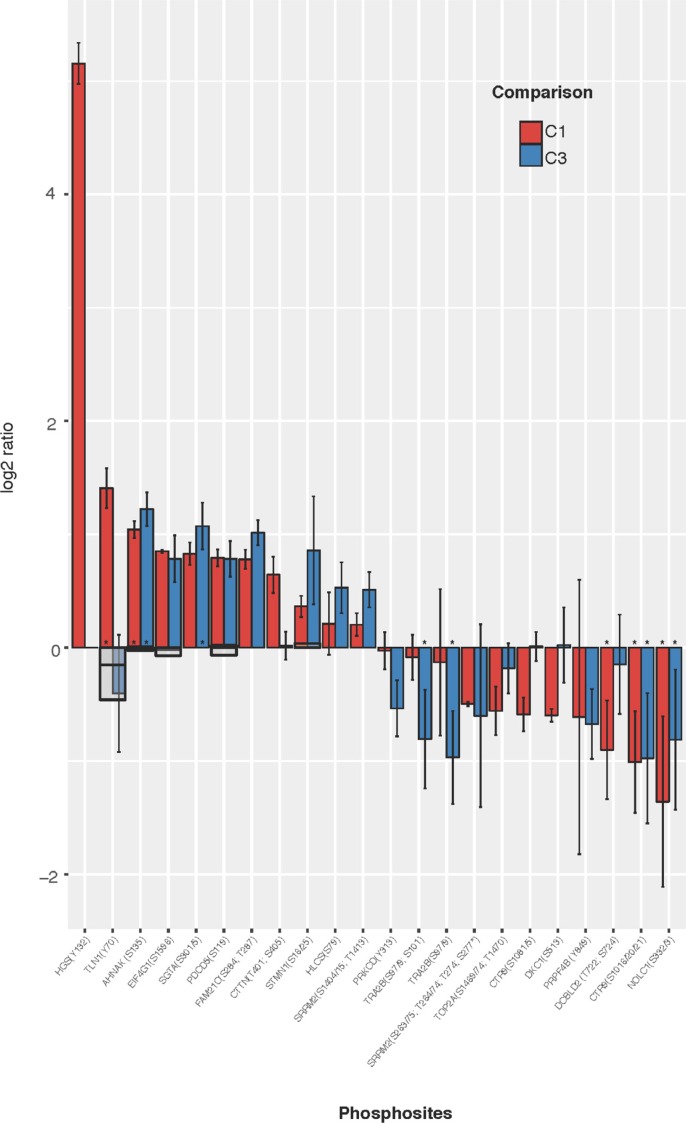
Figure 3. Most significantly regulated phosphosites identified from comparisons of WT vs FUS (C1) and WT vs WT-FGF (C3).
HC phosphopeptides are shown where mean C1 or C3 ratio shows both a substantial (|log2(comparison ratio)| > 0.5) and a significant (using +/–1.96σ) change. Phosphosites observed in only one replicate are excluded. Error bars show 2 standard deviations (log corrected). Where available, reference proteome levels are indicated as grey boxes. Peptides also passing SigB significance shown as (*).

