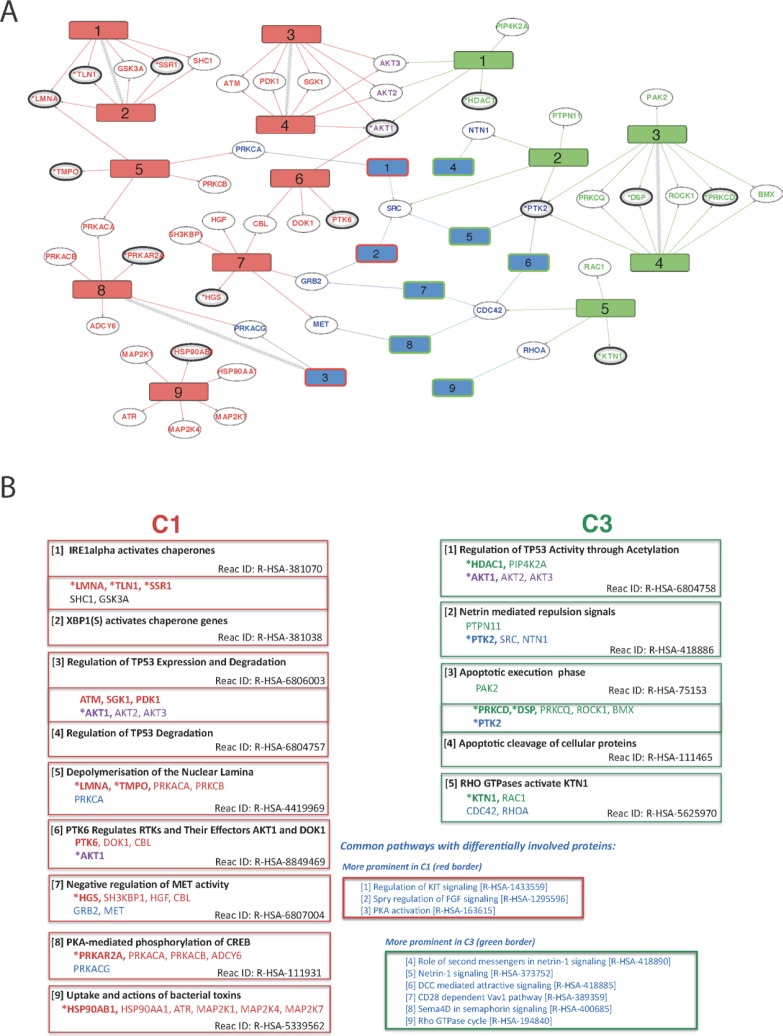
Figure 5. Overview of differentially regulated pathways derived from comparisons of WT vs FUS (C1) and WT vs WT-FGF (C3).
(A) Diagram showing overall connectivity. Reactome pathways uniquely affected in C1 (left, red numbered rectangles) or C3 (right, green numbered rectangles) are shown along with links to protein ‘hits’ on each pathway (ellipses). Pathways common to both conditions, but with differential involvement of proteins are shown in blue, with red or green borders indicating preferential C1 or C3 involvement respectively. Pathways and proteins that link the two conditions are shown if there is evidence of differential involvement and hidden otherwise. Pathways directly connected in the Reactome hierarchy (i.e. related) are connected with zigzags. Proteins are coloured according to their respective pathways (red: C1-only, green: C3-only, purple: linker between C1 & C3 and blue: part of a common pathway that may also link C1 or C3). Confidence of protein identification indicated by reference to HC (*, bold ellipse) or QP (bold ellipse) datasets. (B) Summary of proteins and the Reactome pathway descriptions for each differentially regulated Reactome pathway. Red: C1-only pathway / protein; green: C3-only; purple: protein linking C1-only and C3-only pathways; blue: pathway common to both C1 and C3 but with differentially involved proteins. Protein confidence levels: (*bold) - High, (bold) - Medium and (non-bold) - from network analyses. The pathways are numbered by increasing FDR, except where two have been merged.

