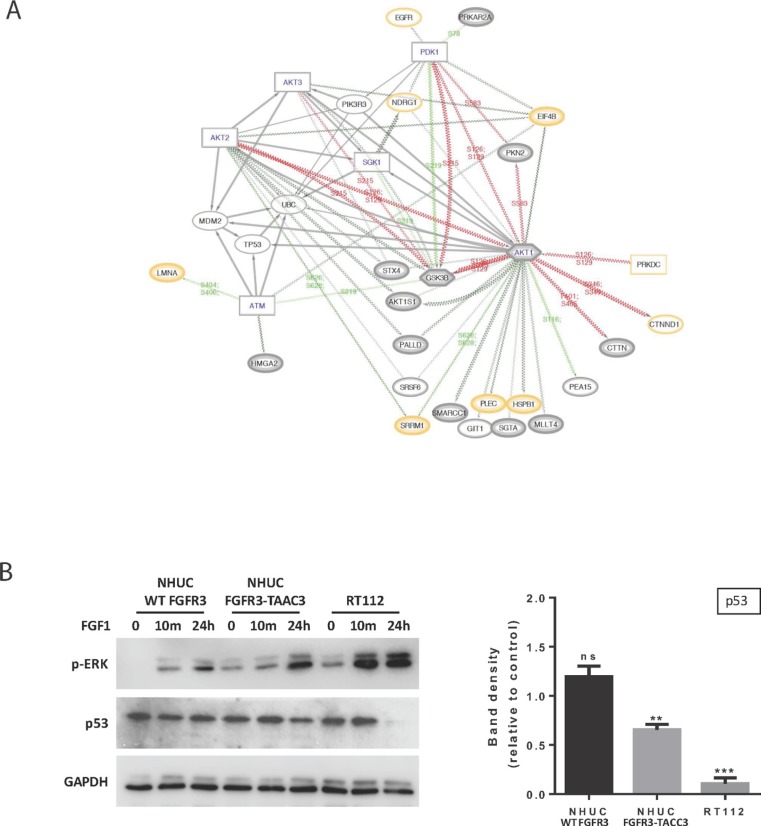
Figure 6. Further analysis of the relationship between FUS and TP53 based on C1 Reactome pathways 3 and 4.
(A) Network diagram expanding of local functional interactions around pathways for the regulation of TP53 expression and degradation (C1-only, 3 & 4). Observed phosphoproteins (ovals) and predicted interacting kinases (rectangles; hexagons if also substrate) shown with significant up or down regulated phosphosite changes (red/green lines respectively). (QP proteins medium grey border; HC thick grey border; proteome yellow border). The diagram shows the central importance of AKT1 in FUS in terms of multiple predicted functional interactions, including TP53, EIF4B, GSK3B and PDK1. AKT1, 2 and 3 all have functional interactions with either TP53 or MDM2. The role of the predicted ATM kinase in these interactions is supported by links to substrates LMNA and HMGA2. (B) Western blotting (left panel) showing p-ERK and TP53 levels in NHUC cells stably expressing FGFR3 (IIIb) WT or FGFR3-TACC3 and the RT112 cell line following stimulation with 100 ng/ml FGF1 and 100 IU/ml Heparin for the indicated time points. GAPDH was used as a loading control. Quantification of TP53 levels after 24-hour stimulation compared to unstimulated cells (right panel) shows that TP53 is significantly down-regulated in the RT112 cells and in the NHUC FGFR3-TACC3 expressing cells, whereas no change is seen in NHUC cells expressing FGFR3 (IIIb) WT (n = 4 separate blots from 2 biological repeats, ± SEM). Data was analysed by multiple one-sample t-tests to a normalised control of 1 with **P < 0.01 and ***P < 0.001.

