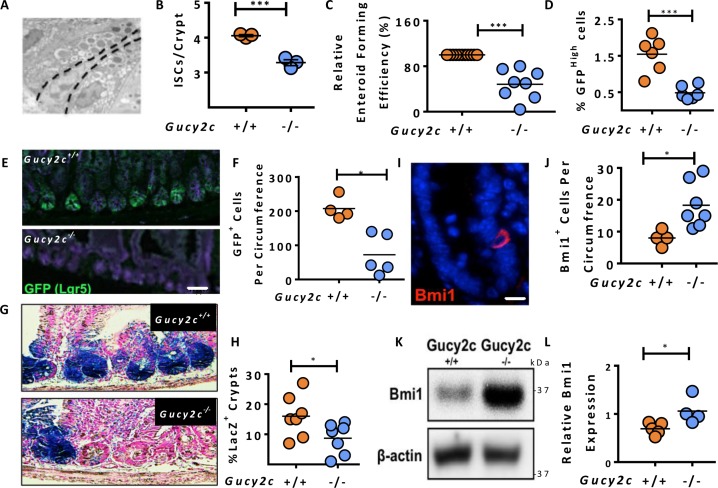
Figure 1. Gucy2c maintains the balance of Lgr5+ and Bmi1+ cells in crypts.
(A–B) Enumeration of CBC ISCs in small intestinal sections using transmission electron microscopy (n = 3 mice, >30 crypts/mouse). (C) Ex vivo enteroid forming capacity of crypts from Gucy2c–/– mice relative to Gucy2c+/+ mice. (D) Quantification of Lgr5+ (GFPHigh) cells by flow cytometry in crypts from Lgr5-EGFP-Cre-Gucy2c+/+ and Gucy2c–/– mice. (E–F) Enumeration of Lgr5+GFP+ cells in intestinal crypts by EGFP IF (>4 sections/mouse). (G–H) Crypt Lgr5+ cell lineage tracing events expressed as a percent of total crypts per section (>4 sections/mouse). (I–J) Bmi1+ cells per intestinal section (>4 sections/mouse). (K–L) Quantification of Bmi1 expressed in isolated crypt lysates, relative to β-actin (n = 5 Gucy2c+/+, 4 Gucy2c–/–). *p < 0.05; ***p < 0.001. Bars in E and G represent 50 µm; bar in I represents 20 µm.

