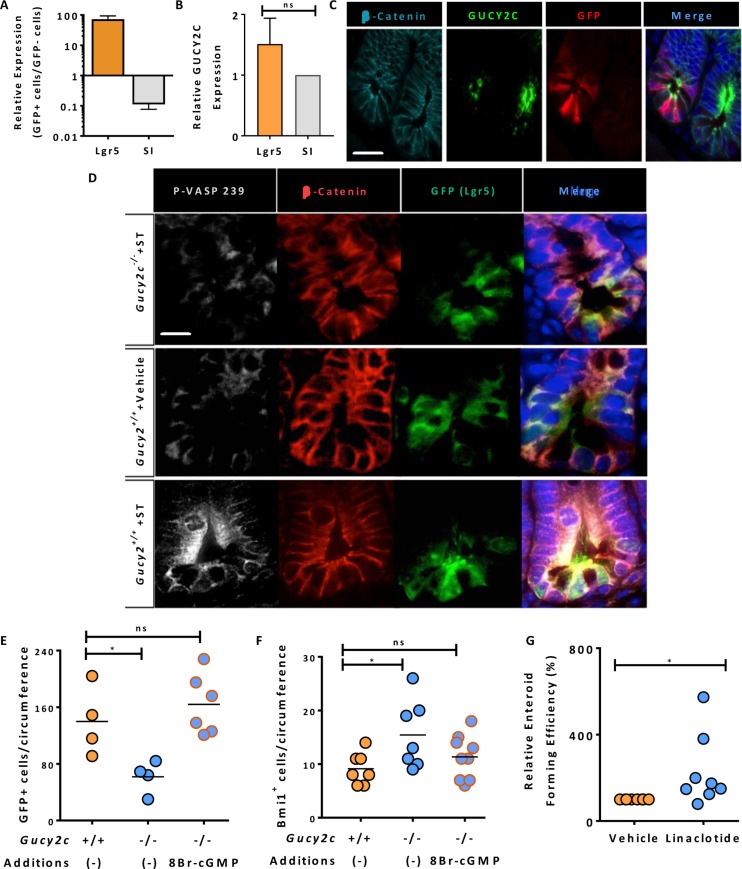
Figure 2. Functional GUCY2C is expressed in Lgr5+ cells.
(A) Flow sorting of GFP+ and GFP– cells from crypts of Lgr5-EGFP-Cre-Gucy2c+/+ mice produced populations of active stem (Lgr5High/SILow) and differentiated (Lgr5Low/SIHigh) cells (n = 3). (B) GUCY2C mRNA expression, quantified by RT-PCR, was compared in Lgr5High/SILow and Lgr5Low/SIHigh cells. (C) GUCY2C (green), immunofluorescence in GFP+ (red) cells. β-catenin (cyan) highlights individual cells and DAPI (blue) highlights nuclei. (D) ST activates GUCY2C and downstream VASP serine 239 phosphorylation (P-VASP-239) (white) in GFP+ (green) cells in Gucy2c+/+, but not Gucy2c–/–, mice. β-catenin (red) highlights individual cells and DAPI (blue) highlights nuclei. (E–F) 8Br-cGMP reconstitutes levels of (E) Lgr5+GFP+ and (F) Bmi1+ cells in crypts of Gucy2c–/– mice that are comparable to those in Gucy2c+/+ mice. (G) Linaclotide enhances the enteroid-forming capacity of crypts in Gucy2c–/– mice relative to Gucy2c+/+ mice. *p < 0.05; ns, not significant. Bar in C represents 50 µm; bar in D represents 20 µm.

