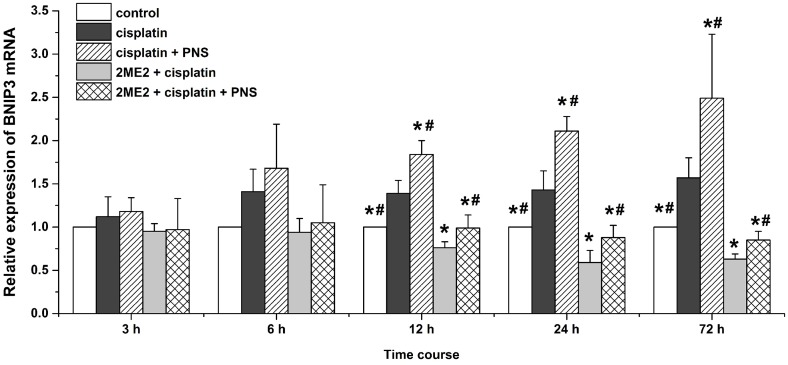
Figure 7. Quantitative RT-PCR analysis of BNIP3 mRNA expression in rat renal tissue samples.
Relative expression of BNIP3 mRNA in renal tissues from control, cisplatin, cisplatin + PNS, 2ME2 + cisplatin and 2ME2 + cisplatin + PNS groups of rats at different time points is shown. Note: Data are represented as mean ± SD (n = 3). * denotes P < 0.05 compared with the cisplatin group; # denotes P < 0.05 when compared with the 2ME2 + cisplatin group.

